Cambodian vs Palestinian No Vehicles in Household
COMPARE
Cambodian
Palestinian
No Vehicles in Household
No Vehicles in Household Comparison
Cambodians
Palestinians
10.9%
NO VEHICLES IN HOUSEHOLD
19.6/ 100
METRIC RATING
200th/ 347
METRIC RANK
8.3%
NO VEHICLES IN HOUSEHOLD
99.7/ 100
METRIC RATING
66th/ 347
METRIC RANK
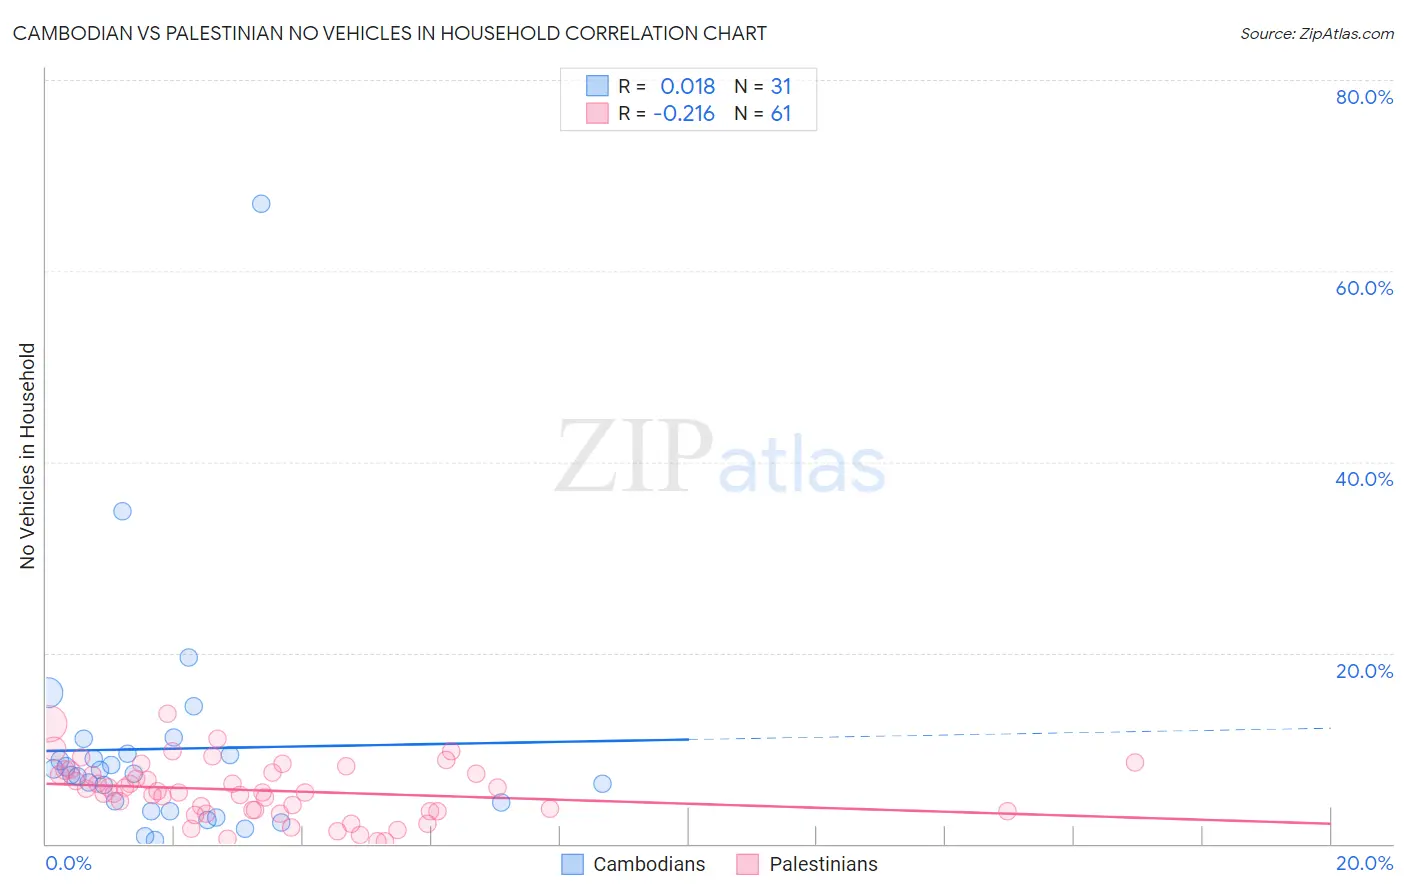
Cambodian vs Palestinian No Vehicles in Household Correlation Chart
The statistical analysis conducted on geographies consisting of 102,425,487 people shows no correlation between the proportion of Cambodians and percentage of households with no vehicle available in the United States with a correlation coefficient (R) of 0.018 and weighted average of 10.9%. Similarly, the statistical analysis conducted on geographies consisting of 216,223,800 people shows a weak negative correlation between the proportion of Palestinians and percentage of households with no vehicle available in the United States with a correlation coefficient (R) of -0.216 and weighted average of 8.3%, a difference of 30.9%.
No Vehicles in Household Correlation Summary
| Measurement | Cambodian | Palestinian |
| Minimum | 0.45% | 0.29% |
| Maximum | 67.0% | 13.6% |
| Range | 66.6% | 13.3% |
| Mean | 9.9% | 5.6% |
| Median | 7.4% | 5.4% |
| Interquartile 25% (IQ1) | 3.4% | 3.4% |
| Interquartile 75% (IQ3) | 9.4% | 7.6% |
| Interquartile Range (IQR) | 6.0% | 4.2% |
| Standard Deviation (Sample) | 12.5% | 3.0% |
| Standard Deviation (Population) | 12.3% | 3.0% |
Similar Demographics by No Vehicles in Household
Demographics Similar to Cambodians by No Vehicles in Household
In terms of no vehicles in household, the demographic groups most similar to Cambodians are Immigrants from Western Europe (10.9%, a difference of 0.11%), Immigrants from Asia (10.9%, a difference of 0.33%), Romanian (10.9%, a difference of 0.38%), Iroquois (10.9%, a difference of 0.45%), and Immigrants from Sweden (10.8%, a difference of 0.64%).
| Demographics | Rating | Rank | No Vehicles in Household |
| Ukrainians | 28.0 /100 | #193 | Fair 10.7% |
| Pueblo | 27.0 /100 | #194 | Fair 10.8% |
| Immigrants | Brazil | 26.3 /100 | #195 | Fair 10.8% |
| Central Americans | 24.3 /100 | #196 | Fair 10.8% |
| Shoshone | 24.1 /100 | #197 | Fair 10.8% |
| Immigrants | Sweden | 22.9 /100 | #198 | Fair 10.8% |
| Immigrants | Asia | 21.3 /100 | #199 | Fair 10.9% |
| Cambodians | 19.6 /100 | #200 | Poor 10.9% |
| Immigrants | Western Europe | 19.1 /100 | #201 | Poor 10.9% |
| Romanians | 17.9 /100 | #202 | Poor 10.9% |
| Iroquois | 17.6 /100 | #203 | Poor 10.9% |
| Guatemalans | 16.1 /100 | #204 | Poor 11.0% |
| Immigrants | Chile | 15.9 /100 | #205 | Poor 11.0% |
| Somalis | 15.9 /100 | #206 | Poor 11.0% |
| Sierra Leoneans | 15.7 /100 | #207 | Poor 11.0% |
Demographics Similar to Palestinians by No Vehicles in Household
In terms of no vehicles in household, the demographic groups most similar to Palestinians are Immigrants from Scotland (8.3%, a difference of 0.010%), Canadian (8.3%, a difference of 0.11%), Immigrants from Iran (8.4%, a difference of 0.41%), Spaniard (8.4%, a difference of 0.46%), and Croatian (8.3%, a difference of 0.86%).
| Demographics | Rating | Rank | No Vehicles in Household |
| Immigrants | India | 99.8 /100 | #59 | Exceptional 8.2% |
| Immigrants | Laos | 99.8 /100 | #60 | Exceptional 8.2% |
| Thais | 99.8 /100 | #61 | Exceptional 8.2% |
| Chinese | 99.8 /100 | #62 | Exceptional 8.2% |
| Slovaks | 99.8 /100 | #63 | Exceptional 8.3% |
| Croatians | 99.8 /100 | #64 | Exceptional 8.3% |
| Canadians | 99.7 /100 | #65 | Exceptional 8.3% |
| Palestinians | 99.7 /100 | #66 | Exceptional 8.3% |
| Immigrants | Scotland | 99.7 /100 | #67 | Exceptional 8.3% |
| Immigrants | Iran | 99.7 /100 | #68 | Exceptional 8.4% |
| Spaniards | 99.7 /100 | #69 | Exceptional 8.4% |
| Cajuns | 99.6 /100 | #70 | Exceptional 8.4% |
| Immigrants | Lebanon | 99.6 /100 | #71 | Exceptional 8.4% |
| Lithuanians | 99.6 /100 | #72 | Exceptional 8.4% |
| Poles | 99.6 /100 | #73 | Exceptional 8.4% |