Immigrants from Belarus vs Palestinian No Vehicles in Household
COMPARE
Immigrants from Belarus
Palestinian
No Vehicles in Household
No Vehicles in Household Comparison
Immigrants from Belarus
Palestinians
16.7%
NO VEHICLES IN HOUSEHOLD
0.0/ 100
METRIC RATING
318th/ 347
METRIC RANK
8.3%
NO VEHICLES IN HOUSEHOLD
99.7/ 100
METRIC RATING
66th/ 347
METRIC RANK
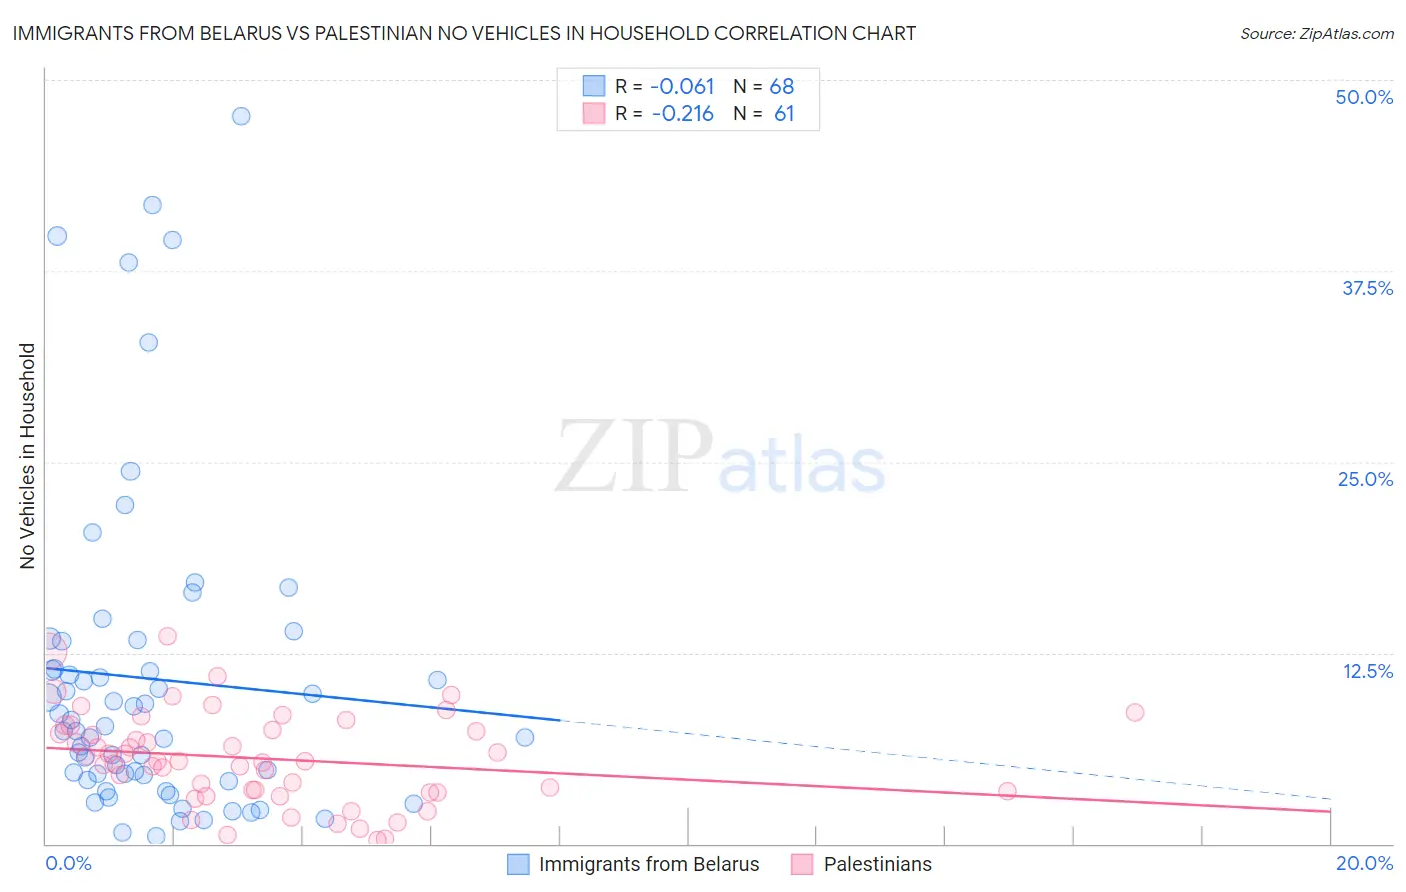
Immigrants from Belarus vs Palestinian No Vehicles in Household Correlation Chart
The statistical analysis conducted on geographies consisting of 150,031,652 people shows a slight negative correlation between the proportion of Immigrants from Belarus and percentage of households with no vehicle available in the United States with a correlation coefficient (R) of -0.061 and weighted average of 16.7%. Similarly, the statistical analysis conducted on geographies consisting of 216,223,800 people shows a weak negative correlation between the proportion of Palestinians and percentage of households with no vehicle available in the United States with a correlation coefficient (R) of -0.216 and weighted average of 8.3%, a difference of 101.0%.
No Vehicles in Household Correlation Summary
| Measurement | Immigrants from Belarus | Palestinian |
| Minimum | 0.49% | 0.29% |
| Maximum | 47.6% | 13.6% |
| Range | 47.1% | 13.3% |
| Mean | 10.8% | 5.6% |
| Median | 7.5% | 5.4% |
| Interquartile 25% (IQ1) | 4.3% | 3.4% |
| Interquartile 75% (IQ3) | 12.4% | 7.6% |
| Interquartile Range (IQR) | 8.0% | 4.2% |
| Standard Deviation (Sample) | 10.5% | 3.0% |
| Standard Deviation (Population) | 10.5% | 3.0% |
Similar Demographics by No Vehicles in Household
Demographics Similar to Immigrants from Belarus by No Vehicles in Household
In terms of no vehicles in household, the demographic groups most similar to Immigrants from Belarus are Immigrants from Ghana (16.6%, a difference of 0.86%), Ghanaian (16.4%, a difference of 1.8%), Alaska Native (17.4%, a difference of 3.9%), Soviet Union (17.4%, a difference of 4.1%), and Cypriot (15.7%, a difference of 6.9%).
| Demographics | Rating | Rank | No Vehicles in Household |
| Immigrants | Israel | 0.0 /100 | #311 | Tragic 15.6% |
| Alaskan Athabascans | 0.0 /100 | #312 | Tragic 15.6% |
| Tohono O'odham | 0.0 /100 | #313 | Tragic 15.6% |
| Albanians | 0.0 /100 | #314 | Tragic 15.6% |
| Cypriots | 0.0 /100 | #315 | Tragic 15.7% |
| Ghanaians | 0.0 /100 | #316 | Tragic 16.4% |
| Immigrants | Ghana | 0.0 /100 | #317 | Tragic 16.6% |
| Immigrants | Belarus | 0.0 /100 | #318 | Tragic 16.7% |
| Alaska Natives | 0.0 /100 | #319 | Tragic 17.4% |
| Soviet Union | 0.0 /100 | #320 | Tragic 17.4% |
| Jamaicans | 0.0 /100 | #321 | Tragic 17.9% |
| Immigrants | Cabo Verde | 0.0 /100 | #322 | Tragic 18.4% |
| Immigrants | Yemen | 0.0 /100 | #323 | Tragic 19.5% |
| Immigrants | Caribbean | 0.0 /100 | #324 | Tragic 19.6% |
| Senegalese | 0.0 /100 | #325 | Tragic 19.8% |
Demographics Similar to Palestinians by No Vehicles in Household
In terms of no vehicles in household, the demographic groups most similar to Palestinians are Immigrants from Scotland (8.3%, a difference of 0.010%), Canadian (8.3%, a difference of 0.11%), Immigrants from Iran (8.4%, a difference of 0.41%), Spaniard (8.4%, a difference of 0.46%), and Croatian (8.3%, a difference of 0.86%).
| Demographics | Rating | Rank | No Vehicles in Household |
| Immigrants | India | 99.8 /100 | #59 | Exceptional 8.2% |
| Immigrants | Laos | 99.8 /100 | #60 | Exceptional 8.2% |
| Thais | 99.8 /100 | #61 | Exceptional 8.2% |
| Chinese | 99.8 /100 | #62 | Exceptional 8.2% |
| Slovaks | 99.8 /100 | #63 | Exceptional 8.3% |
| Croatians | 99.8 /100 | #64 | Exceptional 8.3% |
| Canadians | 99.7 /100 | #65 | Exceptional 8.3% |
| Palestinians | 99.7 /100 | #66 | Exceptional 8.3% |
| Immigrants | Scotland | 99.7 /100 | #67 | Exceptional 8.3% |
| Immigrants | Iran | 99.7 /100 | #68 | Exceptional 8.4% |
| Spaniards | 99.7 /100 | #69 | Exceptional 8.4% |
| Cajuns | 99.6 /100 | #70 | Exceptional 8.4% |
| Immigrants | Lebanon | 99.6 /100 | #71 | Exceptional 8.4% |
| Lithuanians | 99.6 /100 | #72 | Exceptional 8.4% |
| Poles | 99.6 /100 | #73 | Exceptional 8.4% |