Guatemalan vs Nepalese 4 or more Vehicles in Household
COMPARE
Guatemalan
Nepalese
4 or more Vehicles in Household
4 or more Vehicles in Household Comparison
Guatemalans
Nepalese
7.0%
4 OR MORE VEHICLES IN HOUSEHOLD
98.1/ 100
METRIC RATING
106th/ 347
METRIC RANK
8.7%
4 OR MORE VEHICLES IN HOUSEHOLD
100.0/ 100
METRIC RATING
18th/ 347
METRIC RANK
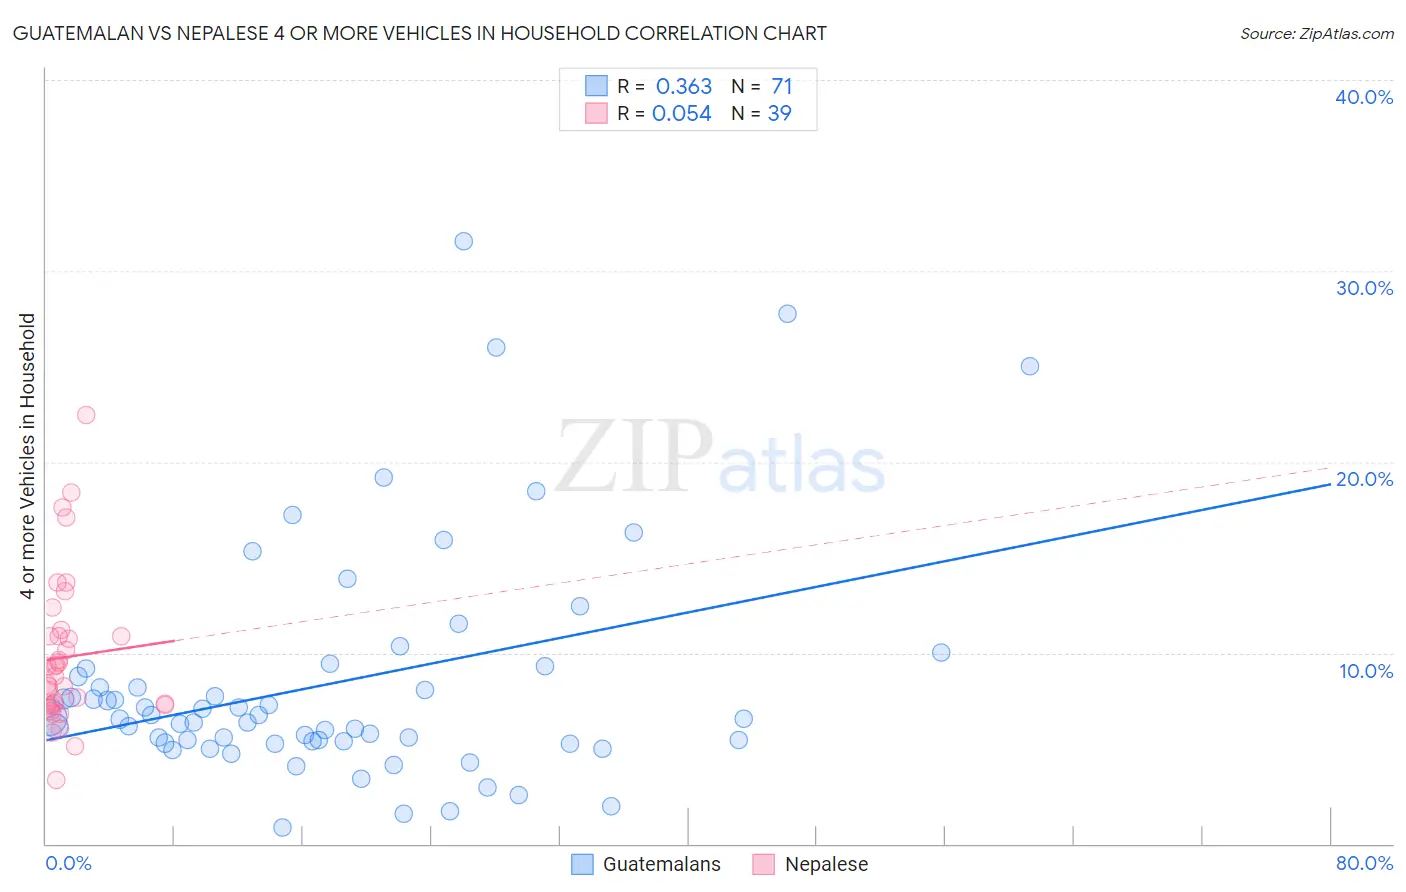
Guatemalan vs Nepalese 4 or more Vehicles in Household Correlation Chart
The statistical analysis conducted on geographies consisting of 407,811,821 people shows a mild positive correlation between the proportion of Guatemalans and percentage of households with 4 or more vehicles available in the United States with a correlation coefficient (R) of 0.363 and weighted average of 7.0%. Similarly, the statistical analysis conducted on geographies consisting of 24,517,800 people shows a slight positive correlation between the proportion of Nepalese and percentage of households with 4 or more vehicles available in the United States with a correlation coefficient (R) of 0.054 and weighted average of 8.7%, a difference of 25.8%.
4 or more Vehicles in Household Correlation Summary
| Measurement | Guatemalan | Nepalese |
| Minimum | 0.82% | 3.4% |
| Maximum | 31.6% | 22.4% |
| Range | 30.8% | 19.1% |
| Mean | 8.5% | 9.8% |
| Median | 6.6% | 8.8% |
| Interquartile 25% (IQ1) | 5.4% | 7.2% |
| Interquartile 75% (IQ3) | 9.2% | 10.9% |
| Interquartile Range (IQR) | 3.8% | 3.7% |
| Standard Deviation (Sample) | 6.1% | 3.9% |
| Standard Deviation (Population) | 6.0% | 3.9% |
Similar Demographics by 4 or more Vehicles in Household
Demographics Similar to Guatemalans by 4 or more Vehicles in Household
In terms of 4 or more vehicles in household, the demographic groups most similar to Guatemalans are Nicaraguan (7.0%, a difference of 0.010%), German Russian (7.0%, a difference of 0.34%), Hmong (7.0%, a difference of 0.35%), French (6.9%, a difference of 0.35%), and Filipino (6.9%, a difference of 0.53%).
| Demographics | Rating | Rank | 4 or more Vehicles in Household |
| Seminole | 98.8 /100 | #99 | Exceptional 7.0% |
| Taiwanese | 98.7 /100 | #100 | Exceptional 7.0% |
| Pakistanis | 98.7 /100 | #101 | Exceptional 7.0% |
| Asians | 98.6 /100 | #102 | Exceptional 7.0% |
| Blackfeet | 98.6 /100 | #103 | Exceptional 7.0% |
| Hmong | 98.3 /100 | #104 | Exceptional 7.0% |
| German Russians | 98.3 /100 | #105 | Exceptional 7.0% |
| Guatemalans | 98.1 /100 | #106 | Exceptional 7.0% |
| Nicaraguans | 98.0 /100 | #107 | Exceptional 7.0% |
| French | 97.7 /100 | #108 | Exceptional 6.9% |
| Filipinos | 97.6 /100 | #109 | Exceptional 6.9% |
| Immigrants | Thailand | 97.0 /100 | #110 | Exceptional 6.9% |
| Aleuts | 97.0 /100 | #111 | Exceptional 6.9% |
| Hopi | 97.0 /100 | #112 | Exceptional 6.9% |
| Canadians | 96.4 /100 | #113 | Exceptional 6.9% |
Demographics Similar to Nepalese by 4 or more Vehicles in Household
In terms of 4 or more vehicles in household, the demographic groups most similar to Nepalese are Ute (8.8%, a difference of 0.10%), Lumbee (8.8%, a difference of 0.43%), Shoshone (8.8%, a difference of 1.1%), Korean (8.6%, a difference of 1.1%), and Chinese (8.8%, a difference of 1.2%).
| Demographics | Rating | Rank | 4 or more Vehicles in Household |
| Immigrants | Mexico | 100.0 /100 | #11 | Exceptional 9.0% |
| Mexicans | 100.0 /100 | #12 | Exceptional 8.9% |
| Hawaiians | 100.0 /100 | #13 | Exceptional 8.9% |
| Chinese | 100.0 /100 | #14 | Exceptional 8.8% |
| Shoshone | 100.0 /100 | #15 | Exceptional 8.8% |
| Lumbee | 100.0 /100 | #16 | Exceptional 8.8% |
| Ute | 100.0 /100 | #17 | Exceptional 8.8% |
| Nepalese | 100.0 /100 | #18 | Exceptional 8.7% |
| Koreans | 100.0 /100 | #19 | Exceptional 8.6% |
| Pueblo | 100.0 /100 | #20 | Exceptional 8.6% |
| Danes | 100.0 /100 | #21 | Exceptional 8.6% |
| Immigrants | Vietnam | 100.0 /100 | #22 | Exceptional 8.6% |
| Immigrants | Philippines | 100.0 /100 | #23 | Exceptional 8.5% |
| Immigrants | Central America | 100.0 /100 | #24 | Exceptional 8.5% |
| Basques | 100.0 /100 | #25 | Exceptional 8.4% |