Iranian vs German 4 or more Vehicles in Household
COMPARE
Iranian
German
4 or more Vehicles in Household
4 or more Vehicles in Household Comparison
Iranians
Germans
6.5%
4 OR MORE VEHICLES IN HOUSEHOLD
69.9/ 100
METRIC RATING
156th/ 347
METRIC RANK
7.5%
4 OR MORE VEHICLES IN HOUSEHOLD
99.9/ 100
METRIC RATING
69th/ 347
METRIC RANK
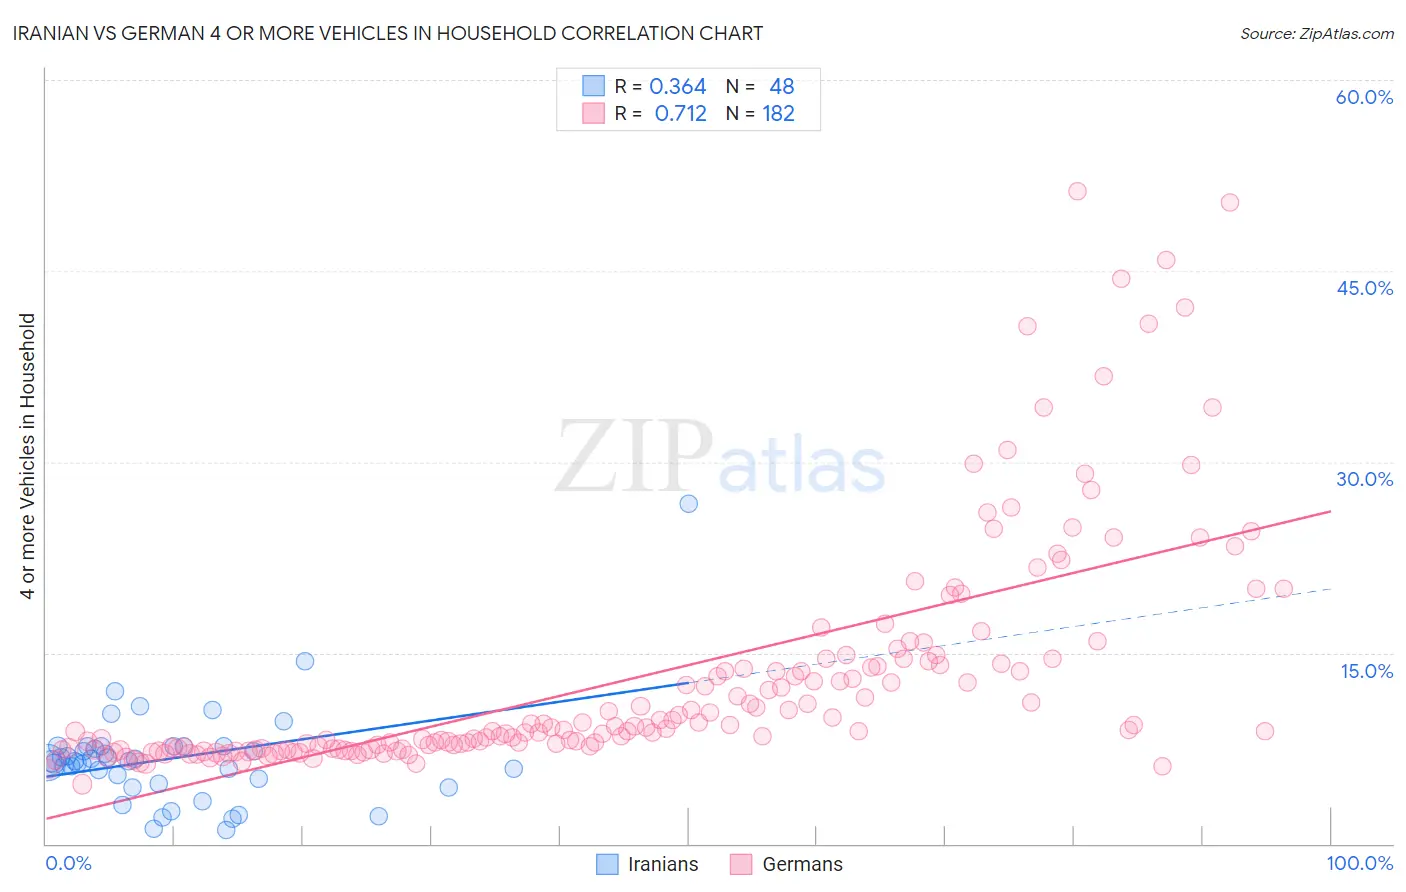
Iranian vs German 4 or more Vehicles in Household Correlation Chart
The statistical analysis conducted on geographies consisting of 315,200,253 people shows a mild positive correlation between the proportion of Iranians and percentage of households with 4 or more vehicles available in the United States with a correlation coefficient (R) of 0.364 and weighted average of 6.5%. Similarly, the statistical analysis conducted on geographies consisting of 576,875,838 people shows a strong positive correlation between the proportion of Germans and percentage of households with 4 or more vehicles available in the United States with a correlation coefficient (R) of 0.712 and weighted average of 7.5%, a difference of 15.3%.
4 or more Vehicles in Household Correlation Summary
| Measurement | Iranian | German |
| Minimum | 1.1% | 4.7% |
| Maximum | 26.7% | 51.2% |
| Range | 25.6% | 46.6% |
| Mean | 6.7% | 13.0% |
| Median | 6.5% | 9.0% |
| Interquartile 25% (IQ1) | 4.9% | 7.5% |
| Interquartile 75% (IQ3) | 7.6% | 14.1% |
| Interquartile Range (IQR) | 2.7% | 6.6% |
| Standard Deviation (Sample) | 4.0% | 9.1% |
| Standard Deviation (Population) | 4.0% | 9.0% |
Similar Demographics by 4 or more Vehicles in Household
Demographics Similar to Iranians by 4 or more Vehicles in Household
In terms of 4 or more vehicles in household, the demographic groups most similar to Iranians are Peruvian (6.5%, a difference of 0.050%), Iroquois (6.5%, a difference of 0.060%), Central American Indian (6.5%, a difference of 0.14%), Immigrants from Armenia (6.5%, a difference of 0.16%), and Yuman (6.5%, a difference of 0.27%).
| Demographics | Rating | Rank | 4 or more Vehicles in Household |
| Greeks | 73.6 /100 | #149 | Good 6.5% |
| New Zealanders | 73.3 /100 | #150 | Good 6.5% |
| Immigrants | Hong Kong | 72.2 /100 | #151 | Good 6.5% |
| Yuman | 72.1 /100 | #152 | Good 6.5% |
| Immigrants | Armenia | 71.2 /100 | #153 | Good 6.5% |
| Central American Indians | 71.1 /100 | #154 | Good 6.5% |
| Iroquois | 70.4 /100 | #155 | Good 6.5% |
| Iranians | 69.9 /100 | #156 | Good 6.5% |
| Peruvians | 69.4 /100 | #157 | Good 6.5% |
| Zimbabweans | 67.1 /100 | #158 | Good 6.4% |
| Indians (Asian) | 66.3 /100 | #159 | Good 6.4% |
| Palestinians | 65.8 /100 | #160 | Good 6.4% |
| Immigrants | Cameroon | 64.4 /100 | #161 | Good 6.4% |
| Immigrants | Pakistan | 63.2 /100 | #162 | Good 6.4% |
| Chileans | 61.2 /100 | #163 | Good 6.4% |
Demographics Similar to Germans by 4 or more Vehicles in Household
In terms of 4 or more vehicles in household, the demographic groups most similar to Germans are Scottish (7.4%, a difference of 0.070%), Chickasaw (7.4%, a difference of 0.20%), Scotch-Irish (7.4%, a difference of 0.50%), Welsh (7.5%, a difference of 0.59%), and Portuguese (7.4%, a difference of 0.60%).
| Demographics | Rating | Rank | 4 or more Vehicles in Household |
| Chippewa | 100.0 /100 | #62 | Exceptional 7.6% |
| Immigrants | Micronesia | 100.0 /100 | #63 | Exceptional 7.6% |
| Bangladeshis | 100.0 /100 | #64 | Exceptional 7.6% |
| Immigrants | Azores | 100.0 /100 | #65 | Exceptional 7.5% |
| Immigrants | Taiwan | 99.9 /100 | #66 | Exceptional 7.5% |
| Americans | 99.9 /100 | #67 | Exceptional 7.5% |
| Welsh | 99.9 /100 | #68 | Exceptional 7.5% |
| Germans | 99.9 /100 | #69 | Exceptional 7.5% |
| Scottish | 99.9 /100 | #70 | Exceptional 7.4% |
| Chickasaw | 99.9 /100 | #71 | Exceptional 7.4% |
| Scotch-Irish | 99.9 /100 | #72 | Exceptional 7.4% |
| Portuguese | 99.9 /100 | #73 | Exceptional 7.4% |
| Icelanders | 99.9 /100 | #74 | Exceptional 7.4% |
| Immigrants | Cambodia | 99.9 /100 | #75 | Exceptional 7.4% |
| Laotians | 99.9 /100 | #76 | Exceptional 7.4% |