Iranian vs French Canadian 4 or more Vehicles in Household
COMPARE
Iranian
French Canadian
4 or more Vehicles in Household
4 or more Vehicles in Household Comparison
Iranians
French Canadians
6.5%
4 OR MORE VEHICLES IN HOUSEHOLD
69.9/ 100
METRIC RATING
156th/ 347
METRIC RANK
6.6%
4 OR MORE VEHICLES IN HOUSEHOLD
85.4/ 100
METRIC RATING
137th/ 347
METRIC RANK
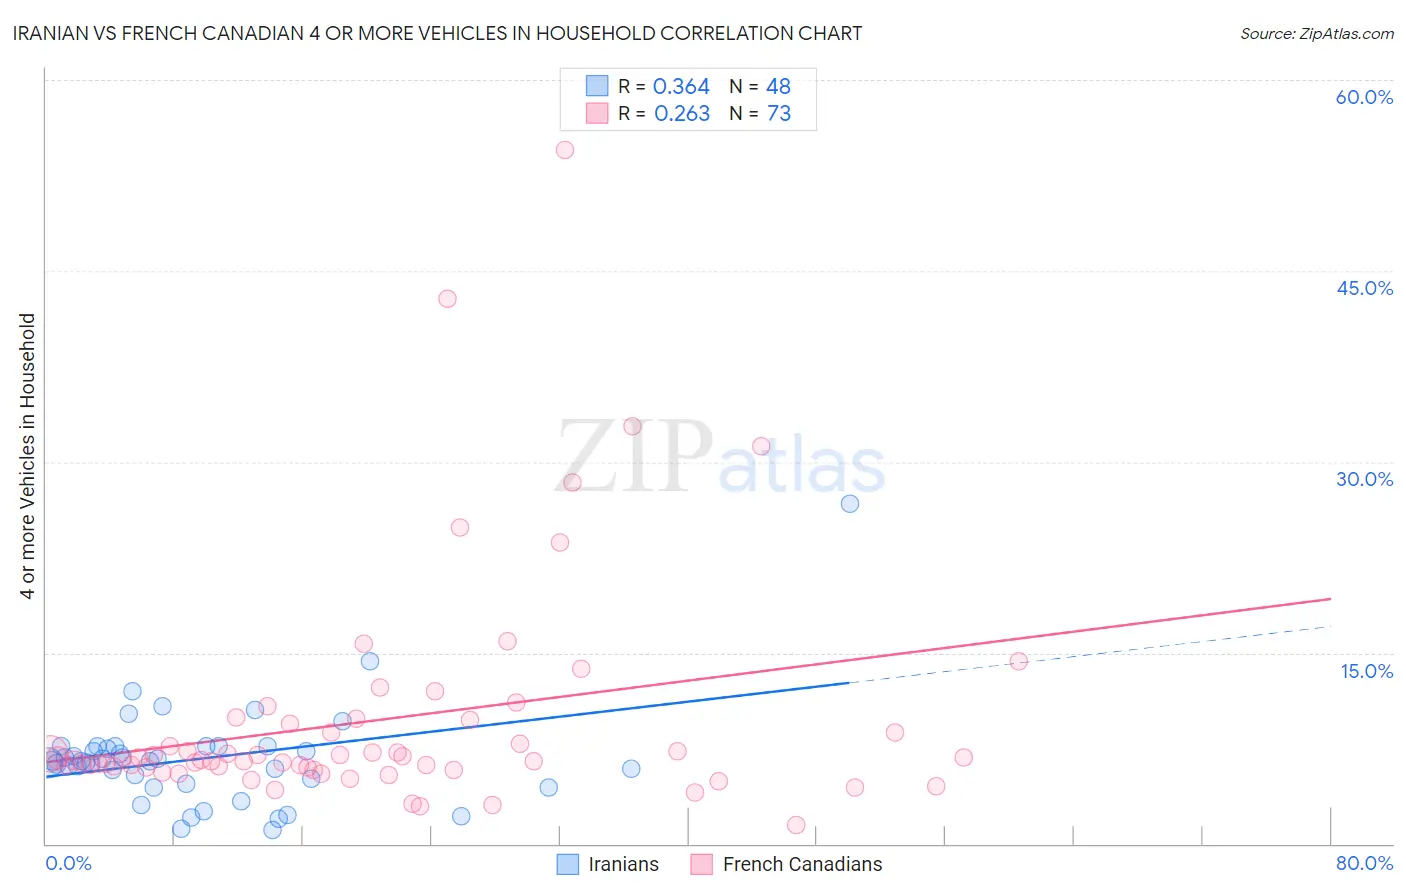
Iranian vs French Canadian 4 or more Vehicles in Household Correlation Chart
The statistical analysis conducted on geographies consisting of 315,200,253 people shows a mild positive correlation between the proportion of Iranians and percentage of households with 4 or more vehicles available in the United States with a correlation coefficient (R) of 0.364 and weighted average of 6.5%. Similarly, the statistical analysis conducted on geographies consisting of 500,260,140 people shows a weak positive correlation between the proportion of French Canadians and percentage of households with 4 or more vehicles available in the United States with a correlation coefficient (R) of 0.263 and weighted average of 6.6%, a difference of 2.3%.
4 or more Vehicles in Household Correlation Summary
| Measurement | Iranian | French Canadian |
| Minimum | 1.1% | 1.5% |
| Maximum | 26.7% | 54.5% |
| Range | 25.6% | 53.0% |
| Mean | 6.7% | 9.7% |
| Median | 6.5% | 6.6% |
| Interquartile 25% (IQ1) | 4.9% | 6.0% |
| Interquartile 75% (IQ3) | 7.6% | 9.6% |
| Interquartile Range (IQR) | 2.7% | 3.6% |
| Standard Deviation (Sample) | 4.0% | 9.0% |
| Standard Deviation (Population) | 4.0% | 8.9% |
Demographics Similar to Iranians and French Canadians by 4 or more Vehicles in Household
In terms of 4 or more vehicles in household, the demographic groups most similar to Iranians are Iroquois (6.5%, a difference of 0.060%), Central American Indian (6.5%, a difference of 0.14%), Immigrants from Armenia (6.5%, a difference of 0.16%), Yuman (6.5%, a difference of 0.27%), and Immigrants from Hong Kong (6.5%, a difference of 0.28%). Similarly, the demographic groups most similar to French Canadians are Italian (6.6%, a difference of 0.16%), Luxembourger (6.6%, a difference of 0.21%), Jordanian (6.6%, a difference of 0.59%), Slavic (6.6%, a difference of 0.67%), and Australian (6.6%, a difference of 0.80%).
| Demographics | Rating | Rank | 4 or more Vehicles in Household |
| Luxembourgers | 86.4 /100 | #136 | Excellent 6.6% |
| French Canadians | 85.4 /100 | #137 | Excellent 6.6% |
| Italians | 84.5 /100 | #138 | Excellent 6.6% |
| Jordanians | 82.1 /100 | #139 | Excellent 6.6% |
| Slavs | 81.6 /100 | #140 | Excellent 6.6% |
| Australians | 80.8 /100 | #141 | Excellent 6.6% |
| Immigrants | Iraq | 79.4 /100 | #142 | Good 6.5% |
| Immigrants | Canada | 78.6 /100 | #143 | Good 6.5% |
| Immigrants | North America | 78.5 /100 | #144 | Good 6.5% |
| Croatians | 77.8 /100 | #145 | Good 6.5% |
| Immigrants | Costa Rica | 74.4 /100 | #146 | Good 6.5% |
| Immigrants | Iran | 73.9 /100 | #147 | Good 6.5% |
| Immigrants | Jordan | 73.7 /100 | #148 | Good 6.5% |
| Greeks | 73.6 /100 | #149 | Good 6.5% |
| New Zealanders | 73.3 /100 | #150 | Good 6.5% |
| Immigrants | Hong Kong | 72.2 /100 | #151 | Good 6.5% |
| Yuman | 72.1 /100 | #152 | Good 6.5% |
| Immigrants | Armenia | 71.2 /100 | #153 | Good 6.5% |
| Central American Indians | 71.1 /100 | #154 | Good 6.5% |
| Iroquois | 70.4 /100 | #155 | Good 6.5% |
| Iranians | 69.9 /100 | #156 | Good 6.5% |