Immigrants from Bulgaria vs German 4 or more Vehicles in Household
COMPARE
Immigrants from Bulgaria
German
4 or more Vehicles in Household
4 or more Vehicles in Household Comparison
Immigrants from Bulgaria
Germans
5.5%
4 OR MORE VEHICLES IN HOUSEHOLD
0.5/ 100
METRIC RATING
277th/ 347
METRIC RANK
7.5%
4 OR MORE VEHICLES IN HOUSEHOLD
99.9/ 100
METRIC RATING
69th/ 347
METRIC RANK
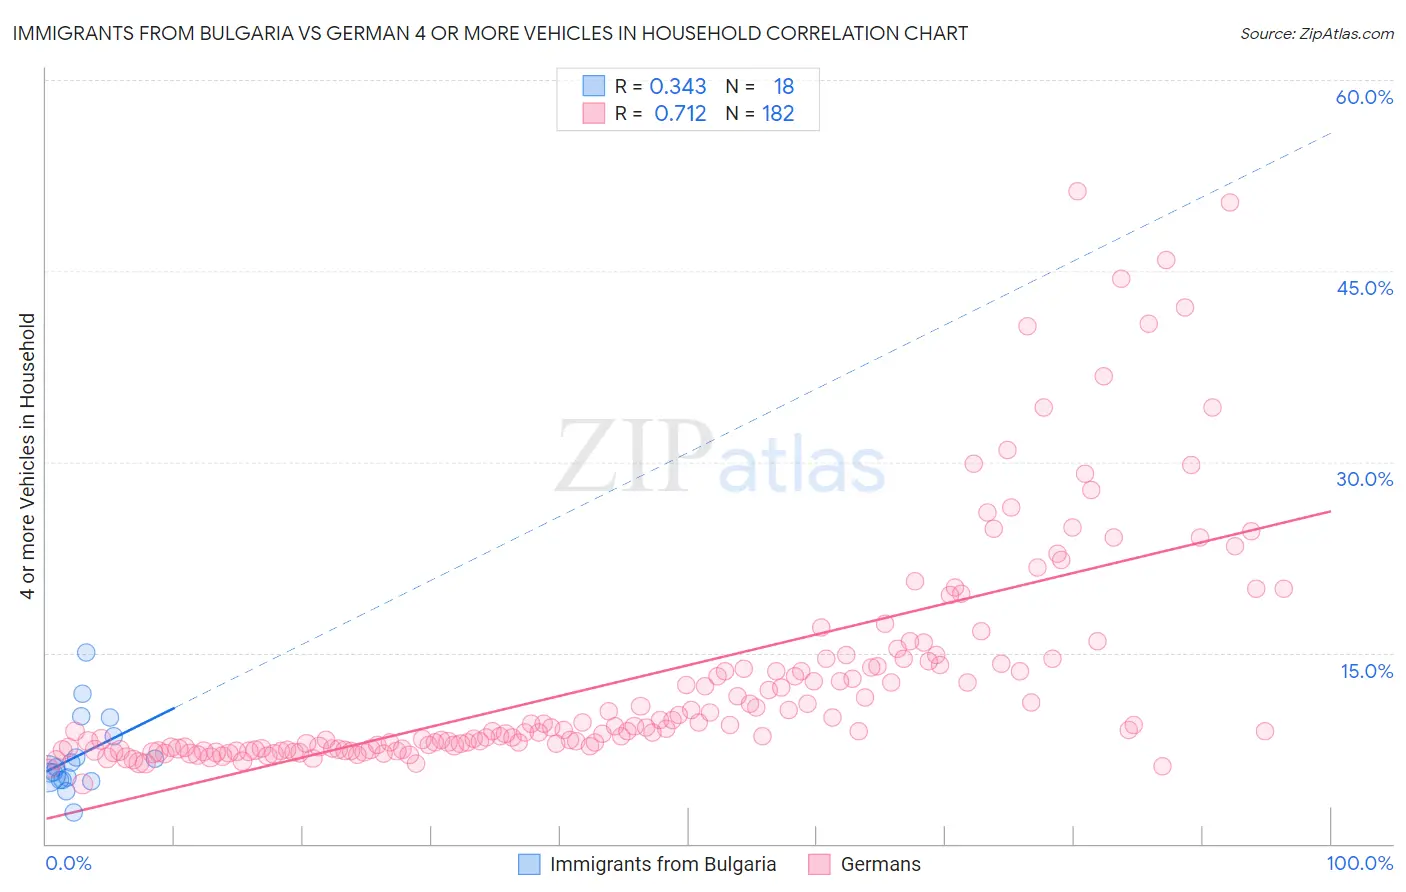
Immigrants from Bulgaria vs German 4 or more Vehicles in Household Correlation Chart
The statistical analysis conducted on geographies consisting of 172,084,774 people shows a mild positive correlation between the proportion of Immigrants from Bulgaria and percentage of households with 4 or more vehicles available in the United States with a correlation coefficient (R) of 0.343 and weighted average of 5.5%. Similarly, the statistical analysis conducted on geographies consisting of 576,875,838 people shows a strong positive correlation between the proportion of Germans and percentage of households with 4 or more vehicles available in the United States with a correlation coefficient (R) of 0.712 and weighted average of 7.5%, a difference of 35.9%.
4 or more Vehicles in Household Correlation Summary
| Measurement | Immigrants from Bulgaria | German |
| Minimum | 2.5% | 4.7% |
| Maximum | 15.0% | 51.2% |
| Range | 12.5% | 46.6% |
| Mean | 6.9% | 13.0% |
| Median | 5.8% | 9.0% |
| Interquartile 25% (IQ1) | 5.1% | 7.5% |
| Interquartile 75% (IQ3) | 8.4% | 14.1% |
| Interquartile Range (IQR) | 3.4% | 6.6% |
| Standard Deviation (Sample) | 3.0% | 9.1% |
| Standard Deviation (Population) | 3.0% | 9.0% |
Similar Demographics by 4 or more Vehicles in Household
Demographics Similar to Immigrants from Bulgaria by 4 or more Vehicles in Household
In terms of 4 or more vehicles in household, the demographic groups most similar to Immigrants from Bulgaria are Immigrants from Latvia (5.5%, a difference of 0.12%), Cambodian (5.5%, a difference of 0.13%), Black/African American (5.5%, a difference of 0.25%), Macedonian (5.5%, a difference of 0.37%), and Immigrants from Kazakhstan (5.5%, a difference of 0.40%).
| Demographics | Rating | Rank | 4 or more Vehicles in Household |
| Okinawans | 0.6 /100 | #270 | Tragic 5.5% |
| Immigrants | Sudan | 0.6 /100 | #271 | Tragic 5.5% |
| Immigrants | Kazakhstan | 0.6 /100 | #272 | Tragic 5.5% |
| Macedonians | 0.6 /100 | #273 | Tragic 5.5% |
| Blacks/African Americans | 0.6 /100 | #274 | Tragic 5.5% |
| Cambodians | 0.5 /100 | #275 | Tragic 5.5% |
| Immigrants | Latvia | 0.5 /100 | #276 | Tragic 5.5% |
| Immigrants | Bulgaria | 0.5 /100 | #277 | Tragic 5.5% |
| Immigrants | Eastern Europe | 0.4 /100 | #278 | Tragic 5.4% |
| Immigrants | Uruguay | 0.3 /100 | #279 | Tragic 5.4% |
| Alsatians | 0.3 /100 | #280 | Tragic 5.4% |
| Immigrants | Western Africa | 0.3 /100 | #281 | Tragic 5.4% |
| Immigrants | Spain | 0.3 /100 | #282 | Tragic 5.4% |
| Immigrants | Ireland | 0.3 /100 | #283 | Tragic 5.4% |
| Brazilians | 0.3 /100 | #284 | Tragic 5.4% |
Demographics Similar to Germans by 4 or more Vehicles in Household
In terms of 4 or more vehicles in household, the demographic groups most similar to Germans are Scottish (7.4%, a difference of 0.070%), Chickasaw (7.4%, a difference of 0.20%), Scotch-Irish (7.4%, a difference of 0.50%), Welsh (7.5%, a difference of 0.59%), and Portuguese (7.4%, a difference of 0.60%).
| Demographics | Rating | Rank | 4 or more Vehicles in Household |
| Chippewa | 100.0 /100 | #62 | Exceptional 7.6% |
| Immigrants | Micronesia | 100.0 /100 | #63 | Exceptional 7.6% |
| Bangladeshis | 100.0 /100 | #64 | Exceptional 7.6% |
| Immigrants | Azores | 100.0 /100 | #65 | Exceptional 7.5% |
| Immigrants | Taiwan | 99.9 /100 | #66 | Exceptional 7.5% |
| Americans | 99.9 /100 | #67 | Exceptional 7.5% |
| Welsh | 99.9 /100 | #68 | Exceptional 7.5% |
| Germans | 99.9 /100 | #69 | Exceptional 7.5% |
| Scottish | 99.9 /100 | #70 | Exceptional 7.4% |
| Chickasaw | 99.9 /100 | #71 | Exceptional 7.4% |
| Scotch-Irish | 99.9 /100 | #72 | Exceptional 7.4% |
| Portuguese | 99.9 /100 | #73 | Exceptional 7.4% |
| Icelanders | 99.9 /100 | #74 | Exceptional 7.4% |
| Immigrants | Cambodia | 99.9 /100 | #75 | Exceptional 7.4% |
| Laotians | 99.9 /100 | #76 | Exceptional 7.4% |