Immigrants from Laos vs German 4 or more Vehicles in Household
COMPARE
Immigrants from Laos
German
4 or more Vehicles in Household
4 or more Vehicles in Household Comparison
Immigrants from Laos
Germans
7.7%
4 OR MORE VEHICLES IN HOUSEHOLD
100.0/ 100
METRIC RATING
51st/ 347
METRIC RANK
7.5%
4 OR MORE VEHICLES IN HOUSEHOLD
99.9/ 100
METRIC RATING
69th/ 347
METRIC RANK
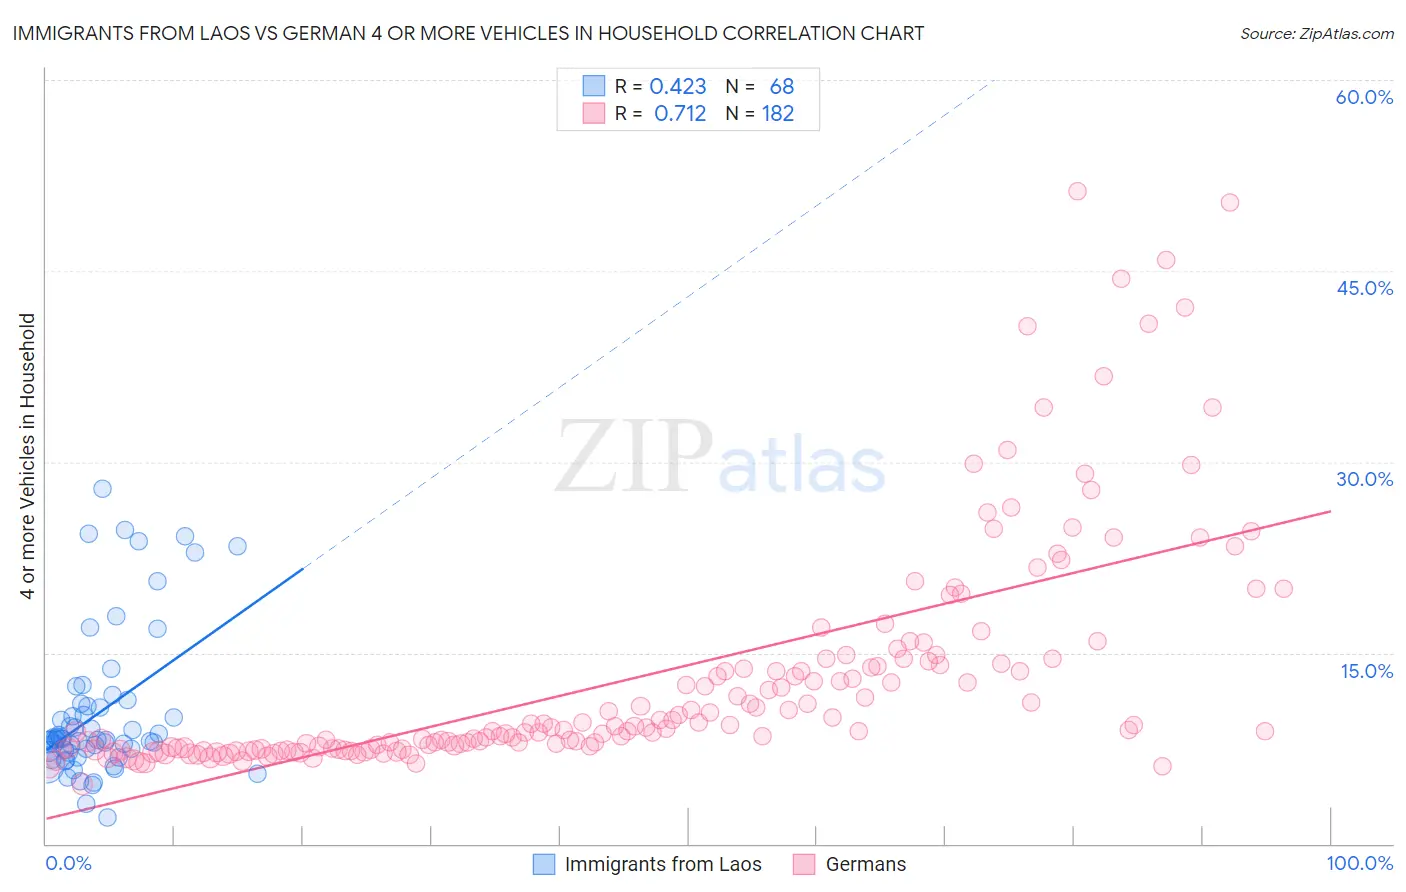
Immigrants from Laos vs German 4 or more Vehicles in Household Correlation Chart
The statistical analysis conducted on geographies consisting of 201,310,160 people shows a moderate positive correlation between the proportion of Immigrants from Laos and percentage of households with 4 or more vehicles available in the United States with a correlation coefficient (R) of 0.423 and weighted average of 7.7%. Similarly, the statistical analysis conducted on geographies consisting of 576,875,838 people shows a strong positive correlation between the proportion of Germans and percentage of households with 4 or more vehicles available in the United States with a correlation coefficient (R) of 0.712 and weighted average of 7.5%, a difference of 3.4%.
4 or more Vehicles in Household Correlation Summary
| Measurement | Immigrants from Laos | German |
| Minimum | 2.1% | 4.7% |
| Maximum | 27.9% | 51.2% |
| Range | 25.8% | 46.6% |
| Mean | 10.3% | 13.0% |
| Median | 8.2% | 9.0% |
| Interquartile 25% (IQ1) | 7.2% | 7.5% |
| Interquartile 75% (IQ3) | 10.9% | 14.1% |
| Interquartile Range (IQR) | 3.7% | 6.6% |
| Standard Deviation (Sample) | 5.8% | 9.1% |
| Standard Deviation (Population) | 5.7% | 9.0% |
Demographics Similar to Immigrants from Laos and Germans by 4 or more Vehicles in Household
In terms of 4 or more vehicles in household, the demographic groups most similar to Immigrants from Laos are Japanese (7.7%, a difference of 0.12%), Immigrants from El Salvador (7.7%, a difference of 0.35%), Malaysian (7.7%, a difference of 0.50%), Dutch (7.7%, a difference of 0.58%), and Immigrants from Oceania (7.6%, a difference of 0.98%). Similarly, the demographic groups most similar to Germans are Scottish (7.4%, a difference of 0.070%), Welsh (7.5%, a difference of 0.59%), American (7.5%, a difference of 0.95%), Immigrants from Taiwan (7.5%, a difference of 0.96%), and Immigrants from the Azores (7.5%, a difference of 1.3%).
| Demographics | Rating | Rank | 4 or more Vehicles in Household |
| Immigrants | El Salvador | 100.0 /100 | #50 | Exceptional 7.7% |
| Immigrants | Laos | 100.0 /100 | #51 | Exceptional 7.7% |
| Japanese | 100.0 /100 | #52 | Exceptional 7.7% |
| Malaysians | 100.0 /100 | #53 | Exceptional 7.7% |
| Dutch | 100.0 /100 | #54 | Exceptional 7.7% |
| Immigrants | Oceania | 100.0 /100 | #55 | Exceptional 7.6% |
| English | 100.0 /100 | #56 | Exceptional 7.6% |
| Pennsylvania Germans | 100.0 /100 | #57 | Exceptional 7.6% |
| Swedes | 100.0 /100 | #58 | Exceptional 7.6% |
| Hispanics or Latinos | 100.0 /100 | #59 | Exceptional 7.6% |
| Spaniards | 100.0 /100 | #60 | Exceptional 7.6% |
| Europeans | 100.0 /100 | #61 | Exceptional 7.6% |
| Chippewa | 100.0 /100 | #62 | Exceptional 7.6% |
| Immigrants | Micronesia | 100.0 /100 | #63 | Exceptional 7.6% |
| Bangladeshis | 100.0 /100 | #64 | Exceptional 7.6% |
| Immigrants | Azores | 100.0 /100 | #65 | Exceptional 7.5% |
| Immigrants | Taiwan | 99.9 /100 | #66 | Exceptional 7.5% |
| Americans | 99.9 /100 | #67 | Exceptional 7.5% |
| Welsh | 99.9 /100 | #68 | Exceptional 7.5% |
| Germans | 99.9 /100 | #69 | Exceptional 7.5% |
| Scottish | 99.9 /100 | #70 | Exceptional 7.4% |