Indian (Asian) vs Immigrants from Trinidad and Tobago Householder Income Under 25 years
COMPARE
Indian (Asian)
Immigrants from Trinidad and Tobago
Householder Income Under 25 years
Householder Income Under 25 years Comparison
Indians (Asian)
Immigrants from Trinidad and Tobago
$58,239
HOUSEHOLDER INCOME UNDER 25 YEARS
100.0/ 100
METRIC RATING
8th/ 347
METRIC RANK
$52,437
HOUSEHOLDER INCOME UNDER 25 YEARS
64.7/ 100
METRIC RATING
164th/ 347
METRIC RANK
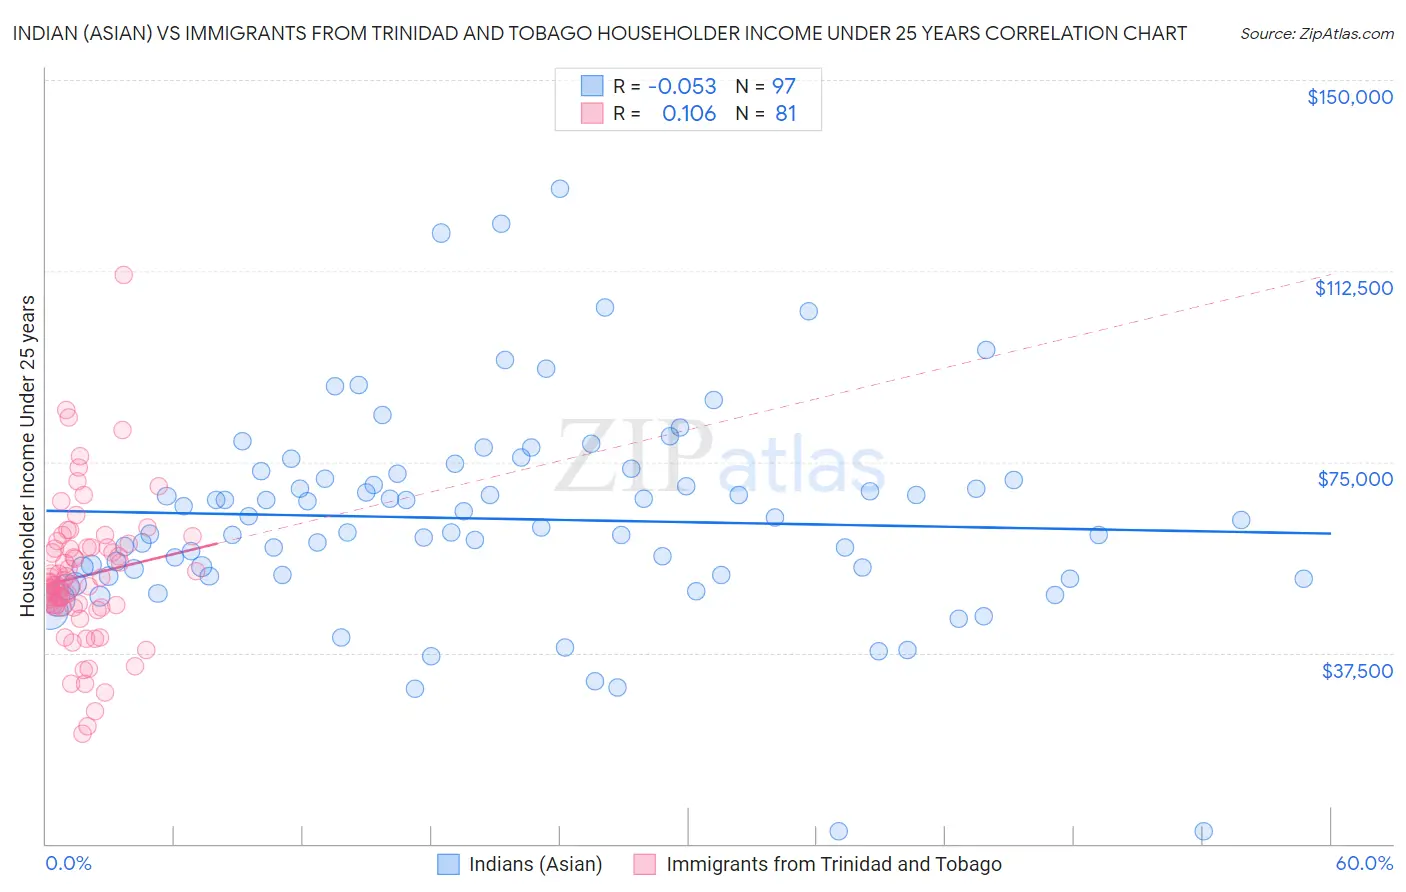
Indian (Asian) vs Immigrants from Trinidad and Tobago Householder Income Under 25 years Correlation Chart
The statistical analysis conducted on geographies consisting of 402,539,075 people shows a slight negative correlation between the proportion of Indians (Asian) and household income with householder under the age of 25 in the United States with a correlation coefficient (R) of -0.053 and weighted average of $58,239. Similarly, the statistical analysis conducted on geographies consisting of 193,741,508 people shows a poor positive correlation between the proportion of Immigrants from Trinidad and Tobago and household income with householder under the age of 25 in the United States with a correlation coefficient (R) of 0.106 and weighted average of $52,437, a difference of 11.1%.
Householder Income Under 25 years Correlation Summary
| Measurement | Indian (Asian) | Immigrants from Trinidad and Tobago |
| Minimum | $2,499 | $21,618 |
| Maximum | $128,558 | $111,719 |
| Range | $126,059 | $90,101 |
| Mean | $63,818 | $52,558 |
| Median | $62,127 | $50,980 |
| Interquartile 25% (IQ1) | $52,606 | $46,433 |
| Interquartile 75% (IQ3) | $72,136 | $58,209 |
| Interquartile Range (IQR) | $19,530 | $11,776 |
| Standard Deviation (Sample) | $20,459 | $14,095 |
| Standard Deviation (Population) | $20,353 | $14,008 |
Similar Demographics by Householder Income Under 25 years
Demographics Similar to Indians (Asian) by Householder Income Under 25 years
In terms of householder income under 25 years, the demographic groups most similar to Indians (Asian) are Chinese ($58,162, a difference of 0.13%), Afghan ($58,019, a difference of 0.38%), Bolivian ($58,506, a difference of 0.46%), Immigrants from China ($57,931, a difference of 0.53%), and Immigrants from Philippines ($57,930, a difference of 0.53%).
| Demographics | Rating | Rank | Householder Income Under 25 years |
| Assyrians/Chaldeans/Syriacs | 100.0 /100 | #1 | Exceptional $65,329 |
| Immigrants | Hong Kong | 100.0 /100 | #2 | Exceptional $62,083 |
| Immigrants | India | 100.0 /100 | #3 | Exceptional $59,914 |
| Immigrants | Taiwan | 100.0 /100 | #4 | Exceptional $59,424 |
| Immigrants | Bolivia | 100.0 /100 | #5 | Exceptional $59,389 |
| Thais | 100.0 /100 | #6 | Exceptional $59,187 |
| Bolivians | 100.0 /100 | #7 | Exceptional $58,506 |
| Indians (Asian) | 100.0 /100 | #8 | Exceptional $58,239 |
| Chinese | 100.0 /100 | #9 | Exceptional $58,162 |
| Afghans | 100.0 /100 | #10 | Exceptional $58,019 |
| Immigrants | China | 100.0 /100 | #11 | Exceptional $57,931 |
| Immigrants | Philippines | 100.0 /100 | #12 | Exceptional $57,930 |
| Immigrants | South Central Asia | 100.0 /100 | #13 | Exceptional $57,818 |
| Filipinos | 100.0 /100 | #14 | Exceptional $57,740 |
| Koreans | 100.0 /100 | #15 | Exceptional $57,730 |
Demographics Similar to Immigrants from Trinidad and Tobago by Householder Income Under 25 years
In terms of householder income under 25 years, the demographic groups most similar to Immigrants from Trinidad and Tobago are Immigrants from Chile ($52,440, a difference of 0.010%), Immigrants from Cambodia ($52,450, a difference of 0.030%), Uruguayan ($52,465, a difference of 0.050%), Polish ($52,407, a difference of 0.060%), and Immigrants from Austria ($52,400, a difference of 0.070%).
| Demographics | Rating | Rank | Householder Income Under 25 years |
| Ghanaians | 72.9 /100 | #157 | Good $52,594 |
| Immigrants | Netherlands | 72.8 /100 | #158 | Good $52,592 |
| Mongolians | 70.2 /100 | #159 | Good $52,540 |
| Immigrants | Turkey | 68.3 /100 | #160 | Good $52,503 |
| Uruguayans | 66.2 /100 | #161 | Good $52,465 |
| Immigrants | Cambodia | 65.4 /100 | #162 | Good $52,450 |
| Immigrants | Chile | 64.8 /100 | #163 | Good $52,440 |
| Immigrants | Trinidad and Tobago | 64.7 /100 | #164 | Good $52,437 |
| Poles | 63.0 /100 | #165 | Good $52,407 |
| Immigrants | Austria | 62.6 /100 | #166 | Good $52,400 |
| Immigrants | Uganda | 61.1 /100 | #167 | Good $52,374 |
| Japanese | 60.5 /100 | #168 | Good $52,365 |
| Canadians | 58.8 /100 | #169 | Average $52,336 |
| Israelis | 58.8 /100 | #170 | Average $52,335 |
| Immigrants | Uruguay | 56.8 /100 | #171 | Average $52,302 |