Belgian vs Immigrants from Trinidad and Tobago 4 or more Vehicles in Household
COMPARE
Belgian
Immigrants from Trinidad and Tobago
4 or more Vehicles in Household
4 or more Vehicles in Household Comparison
Belgians
Immigrants from Trinidad and Tobago
6.8%
4 OR MORE VEHICLES IN HOUSEHOLD
94.1/ 100
METRIC RATING
126th/ 347
METRIC RANK
4.1%
4 OR MORE VEHICLES IN HOUSEHOLD
0.0/ 100
METRIC RATING
334th/ 347
METRIC RANK
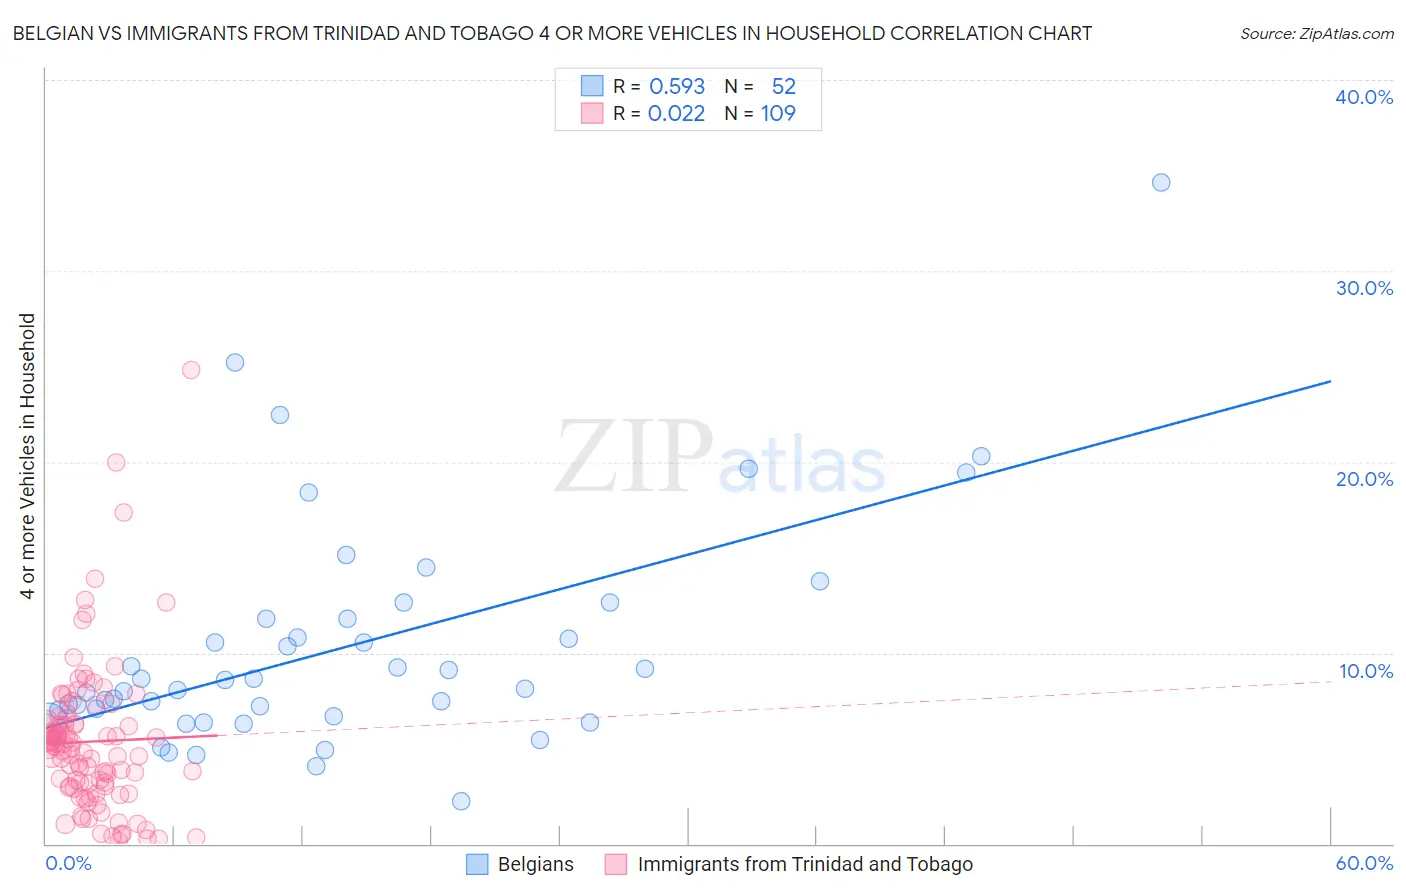
Belgian vs Immigrants from Trinidad and Tobago 4 or more Vehicles in Household Correlation Chart
The statistical analysis conducted on geographies consisting of 354,799,341 people shows a substantial positive correlation between the proportion of Belgians and percentage of households with 4 or more vehicles available in the United States with a correlation coefficient (R) of 0.593 and weighted average of 6.8%. Similarly, the statistical analysis conducted on geographies consisting of 222,352,936 people shows no correlation between the proportion of Immigrants from Trinidad and Tobago and percentage of households with 4 or more vehicles available in the United States with a correlation coefficient (R) of 0.022 and weighted average of 4.1%, a difference of 64.8%.
4 or more Vehicles in Household Correlation Summary
| Measurement | Belgian | Immigrants from Trinidad and Tobago |
| Minimum | 2.2% | 0.11% |
| Maximum | 34.6% | 24.8% |
| Range | 32.4% | 24.7% |
| Mean | 10.3% | 5.3% |
| Median | 8.3% | 5.0% |
| Interquartile 25% (IQ1) | 6.8% | 3.0% |
| Interquartile 75% (IQ3) | 11.8% | 6.4% |
| Interquartile Range (IQR) | 4.9% | 3.4% |
| Standard Deviation (Sample) | 6.0% | 3.9% |
| Standard Deviation (Population) | 5.9% | 3.9% |
Similar Demographics by 4 or more Vehicles in Household
Demographics Similar to Belgians by 4 or more Vehicles in Household
In terms of 4 or more vehicles in household, the demographic groups most similar to Belgians are Austrian (6.8%, a difference of 0.010%), Immigrants from Asia (6.8%, a difference of 0.10%), Immigrants from Korea (6.8%, a difference of 0.12%), Immigrants (6.8%, a difference of 0.20%), and Immigrants from Germany (6.8%, a difference of 0.27%).
| Demographics | Rating | Rank | 4 or more Vehicles in Household |
| Costa Ricans | 95.5 /100 | #119 | Exceptional 6.8% |
| Comanche | 94.8 /100 | #120 | Exceptional 6.8% |
| Immigrants | Germany | 94.7 /100 | #121 | Exceptional 6.8% |
| Immigrants | Nicaragua | 94.7 /100 | #122 | Exceptional 6.8% |
| Immigrants | Immigrants | 94.6 /100 | #123 | Exceptional 6.8% |
| Immigrants | Asia | 94.4 /100 | #124 | Exceptional 6.8% |
| Austrians | 94.1 /100 | #125 | Exceptional 6.8% |
| Belgians | 94.1 /100 | #126 | Exceptional 6.8% |
| Immigrants | Korea | 93.8 /100 | #127 | Exceptional 6.8% |
| Immigrants | Bolivia | 92.5 /100 | #128 | Exceptional 6.7% |
| Immigrants | England | 92.0 /100 | #129 | Exceptional 6.7% |
| Immigrants | Scotland | 89.0 /100 | #130 | Excellent 6.7% |
| Maltese | 88.4 /100 | #131 | Excellent 6.7% |
| Immigrants | Netherlands | 87.8 /100 | #132 | Excellent 6.6% |
| Armenians | 86.9 /100 | #133 | Excellent 6.6% |
Demographics Similar to Immigrants from Trinidad and Tobago by 4 or more Vehicles in Household
In terms of 4 or more vehicles in household, the demographic groups most similar to Immigrants from Trinidad and Tobago are Immigrants from Albania (4.1%, a difference of 0.21%), Immigrants from Dominica (4.2%, a difference of 1.9%), West Indian (4.2%, a difference of 2.8%), Immigrants from Ecuador (4.2%, a difference of 3.1%), and Immigrants from Senegal (4.2%, a difference of 3.3%).
| Demographics | Rating | Rank | 4 or more Vehicles in Household |
| Senegalese | 0.0 /100 | #327 | Tragic 4.3% |
| Trinidadians and Tobagonians | 0.0 /100 | #328 | Tragic 4.3% |
| Immigrants | Senegal | 0.0 /100 | #329 | Tragic 4.2% |
| Immigrants | Ecuador | 0.0 /100 | #330 | Tragic 4.2% |
| West Indians | 0.0 /100 | #331 | Tragic 4.2% |
| Immigrants | Dominica | 0.0 /100 | #332 | Tragic 4.2% |
| Immigrants | Albania | 0.0 /100 | #333 | Tragic 4.1% |
| Immigrants | Trinidad and Tobago | 0.0 /100 | #334 | Tragic 4.1% |
| Barbadians | 0.0 /100 | #335 | Tragic 3.9% |
| Immigrants | Bangladesh | 0.0 /100 | #336 | Tragic 3.9% |
| Vietnamese | 0.0 /100 | #337 | Tragic 3.9% |
| Immigrants | Cabo Verde | 0.0 /100 | #338 | Tragic 3.8% |
| Immigrants | Uzbekistan | 0.0 /100 | #339 | Tragic 3.6% |
| Immigrants | Barbados | 0.0 /100 | #340 | Tragic 3.6% |
| Dominicans | 0.0 /100 | #341 | Tragic 3.5% |