Immigrants vs Iroquois 3 or more Vehicles in Household
COMPARE
Immigrants
Iroquois
3 or more Vehicles in Household
3 or more Vehicles in Household Comparison
Immigrants
Iroquois
20.0%
3 OR MORE VEHICLES IN HOUSEHOLD
80.8/ 100
METRIC RATING
150th/ 347
METRIC RANK
19.4%
3 OR MORE VEHICLES IN HOUSEHOLD
46.0/ 100
METRIC RATING
176th/ 347
METRIC RANK
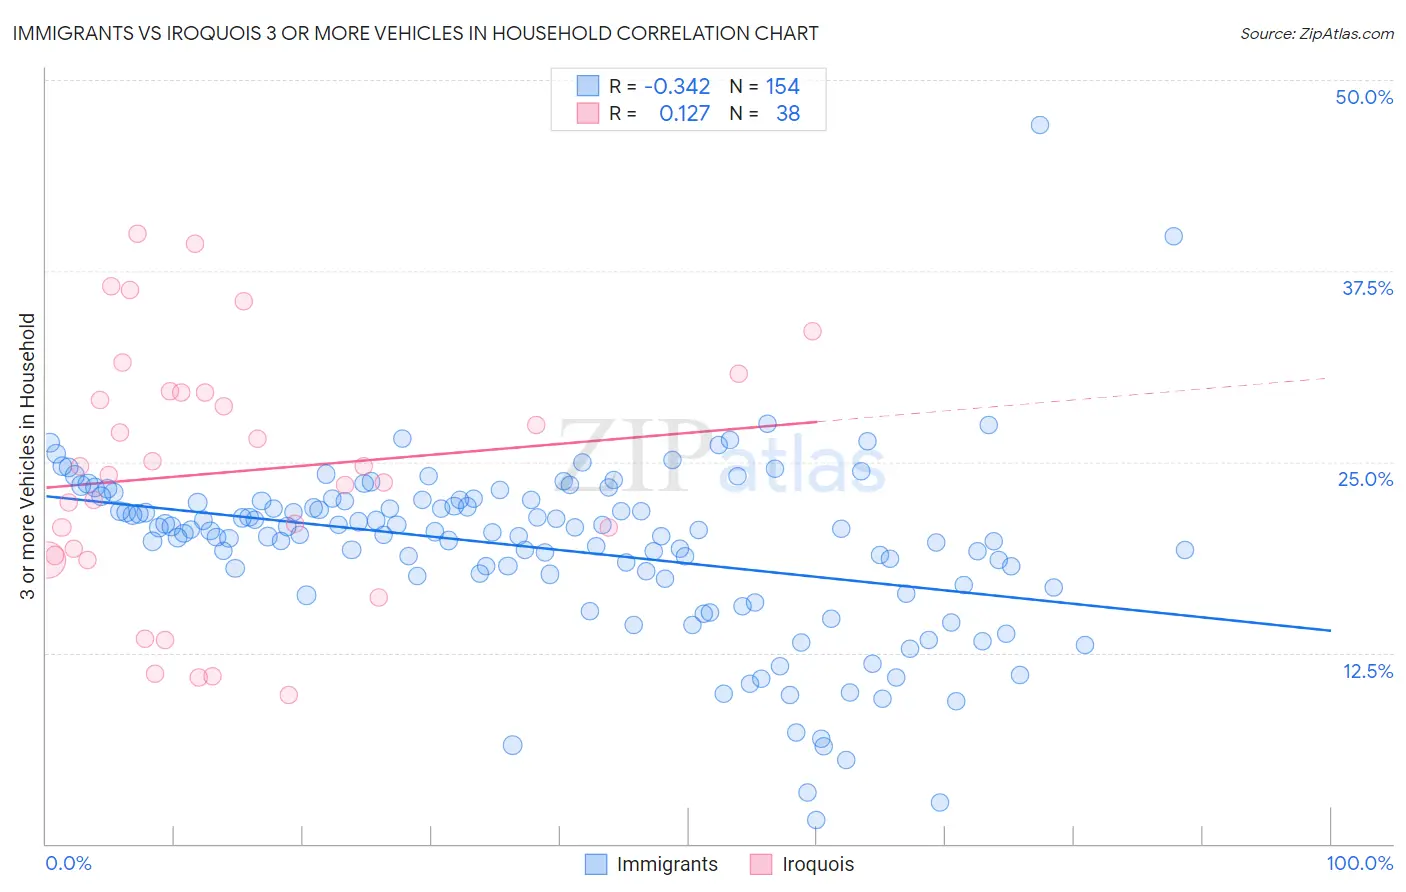
Immigrants vs Iroquois 3 or more Vehicles in Household Correlation Chart
The statistical analysis conducted on geographies consisting of 576,716,995 people shows a mild negative correlation between the proportion of Immigrants and percentage of households with 3 or more vehicles available in the United States with a correlation coefficient (R) of -0.342 and weighted average of 20.0%. Similarly, the statistical analysis conducted on geographies consisting of 207,225,565 people shows a poor positive correlation between the proportion of Iroquois and percentage of households with 3 or more vehicles available in the United States with a correlation coefficient (R) of 0.127 and weighted average of 19.4%, a difference of 3.0%.
3 or more Vehicles in Household Correlation Summary
| Measurement | Immigrants | Iroquois |
| Minimum | 1.6% | 9.7% |
| Maximum | 47.1% | 39.9% |
| Range | 45.5% | 30.2% |
| Mean | 19.3% | 24.3% |
| Median | 20.4% | 24.4% |
| Interquartile 25% (IQ1) | 17.4% | 18.9% |
| Interquartile 75% (IQ3) | 22.4% | 29.5% |
| Interquartile Range (IQR) | 5.1% | 10.6% |
| Standard Deviation (Sample) | 5.9% | 8.1% |
| Standard Deviation (Population) | 5.9% | 8.0% |
Similar Demographics by 3 or more Vehicles in Household
Demographics Similar to Immigrants by 3 or more Vehicles in Household
In terms of 3 or more vehicles in household, the demographic groups most similar to Immigrants are Immigrants from Iran (20.0%, a difference of 0.020%), Taiwanese (20.0%, a difference of 0.020%), Lebanese (20.0%, a difference of 0.12%), Guatemalan (20.1%, a difference of 0.22%), and Slovak (20.1%, a difference of 0.28%).
| Demographics | Rating | Rank | 3 or more Vehicles in Household |
| Lithuanians | 84.4 /100 | #143 | Excellent 20.1% |
| Iranians | 84.0 /100 | #144 | Excellent 20.1% |
| Palestinians | 83.9 /100 | #145 | Excellent 20.1% |
| Australians | 83.6 /100 | #146 | Excellent 20.1% |
| Slovaks | 83.0 /100 | #147 | Excellent 20.1% |
| Guatemalans | 82.6 /100 | #148 | Excellent 20.1% |
| Immigrants | Iran | 80.9 /100 | #149 | Excellent 20.0% |
| Immigrants | Immigrants | 80.8 /100 | #150 | Excellent 20.0% |
| Taiwanese | 80.6 /100 | #151 | Excellent 20.0% |
| Lebanese | 79.8 /100 | #152 | Good 20.0% |
| Yuman | 75.6 /100 | #153 | Good 19.9% |
| Immigrants | Jordan | 75.0 /100 | #154 | Good 19.9% |
| Tlingit-Haida | 73.4 /100 | #155 | Good 19.9% |
| Thais | 71.1 /100 | #156 | Good 19.8% |
| Hungarians | 70.5 /100 | #157 | Good 19.8% |
Demographics Similar to Iroquois by 3 or more Vehicles in Household
In terms of 3 or more vehicles in household, the demographic groups most similar to Iroquois are Syrian (19.5%, a difference of 0.070%), Immigrants from South Africa (19.5%, a difference of 0.30%), Immigrants from Northern Europe (19.5%, a difference of 0.32%), Kiowa (19.5%, a difference of 0.37%), and Immigrants from Peru (19.4%, a difference of 0.38%).
| Demographics | Rating | Rank | 3 or more Vehicles in Household |
| Immigrants | Denmark | 57.6 /100 | #169 | Average 19.6% |
| Iraqis | 56.0 /100 | #170 | Average 19.6% |
| Immigrants | Western Europe | 53.2 /100 | #171 | Average 19.5% |
| Kiowa | 50.9 /100 | #172 | Average 19.5% |
| Immigrants | Northern Europe | 50.2 /100 | #173 | Average 19.5% |
| Immigrants | South Africa | 50.0 /100 | #174 | Average 19.5% |
| Syrians | 47.0 /100 | #175 | Average 19.5% |
| Iroquois | 46.0 /100 | #176 | Average 19.4% |
| Immigrants | Peru | 41.1 /100 | #177 | Average 19.4% |
| Immigrants | Syria | 40.3 /100 | #178 | Average 19.4% |
| Immigrants | South Central Asia | 38.9 /100 | #179 | Fair 19.3% |
| South Africans | 37.5 /100 | #180 | Fair 19.3% |
| Romanians | 37.1 /100 | #181 | Fair 19.3% |
| Cubans | 36.6 /100 | #182 | Fair 19.3% |
| Cajuns | 36.0 /100 | #183 | Fair 19.3% |