Immigrants vs Iroquois Unemployment Among Ages 30 to 34 years
COMPARE
Immigrants
Iroquois
Unemployment Among Ages 30 to 34 years
Unemployment Among Ages 30 to 34 years Comparison
Immigrants
Iroquois
5.7%
UNEMPLOYMENT AMONG AGES 30 TO 34 YEARS
7.1/ 100
METRIC RATING
213th/ 347
METRIC RANK
5.9%
UNEMPLOYMENT AMONG AGES 30 TO 34 YEARS
1.0/ 100
METRIC RATING
232nd/ 347
METRIC RANK
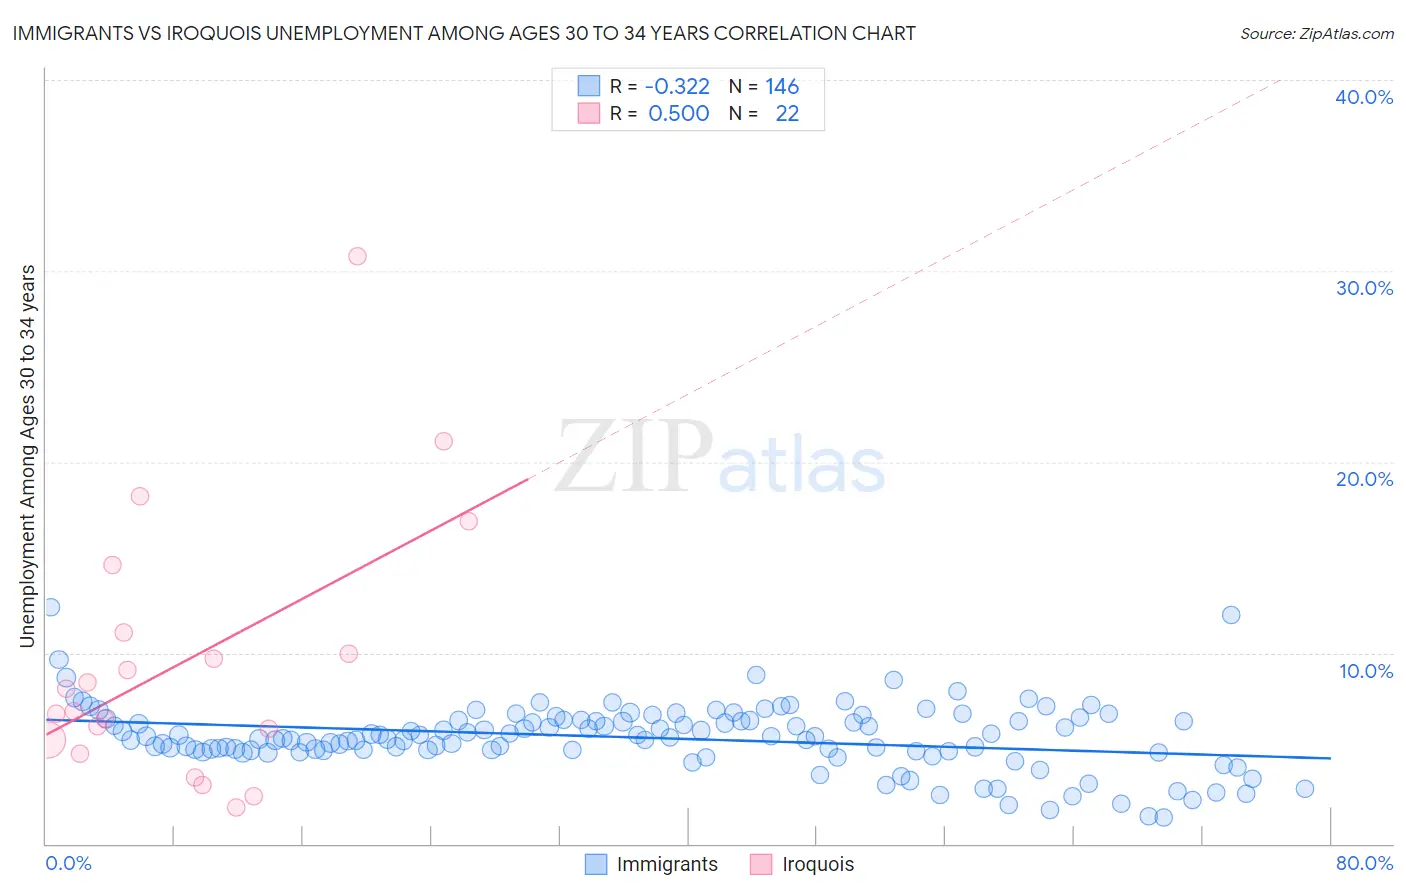
Immigrants vs Iroquois Unemployment Among Ages 30 to 34 years Correlation Chart
The statistical analysis conducted on geographies consisting of 503,366,783 people shows a mild negative correlation between the proportion of Immigrants and unemployment rate among population between the ages 30 and 34 in the United States with a correlation coefficient (R) of -0.322 and weighted average of 5.7%. Similarly, the statistical analysis conducted on geographies consisting of 198,715,109 people shows a moderate positive correlation between the proportion of Iroquois and unemployment rate among population between the ages 30 and 34 in the United States with a correlation coefficient (R) of 0.500 and weighted average of 5.9%, a difference of 3.3%.
Unemployment Among Ages 30 to 34 years Correlation Summary
| Measurement | Immigrants | Iroquois |
| Minimum | 1.4% | 1.9% |
| Maximum | 12.4% | 30.8% |
| Range | 11.0% | 28.9% |
| Mean | 5.6% | 9.6% |
| Median | 5.6% | 7.5% |
| Interquartile 25% (IQ1) | 4.9% | 5.4% |
| Interquartile 75% (IQ3) | 6.5% | 11.1% |
| Interquartile Range (IQR) | 1.6% | 5.7% |
| Standard Deviation (Sample) | 1.7% | 7.0% |
| Standard Deviation (Population) | 1.7% | 6.8% |
Demographics Similar to Immigrants and Iroquois by Unemployment Among Ages 30 to 34 years
In terms of unemployment among ages 30 to 34 years, the demographic groups most similar to Immigrants are Immigrants from Panama (5.7%, a difference of 0.34%), Scotch-Irish (5.7%, a difference of 0.35%), Immigrants from Cambodia (5.7%, a difference of 0.35%), Immigrants from Syria (5.7%, a difference of 0.46%), and Immigrants from Fiji (5.7%, a difference of 0.59%). Similarly, the demographic groups most similar to Iroquois are Japanese (5.9%, a difference of 0.13%), Hawaiian (5.9%, a difference of 0.26%), Immigrants from Uzbekistan (5.9%, a difference of 0.59%), Immigrants from Bahamas (5.8%, a difference of 0.90%), and Spanish (5.8%, a difference of 0.97%).
| Demographics | Rating | Rank | Unemployment Among Ages 30 to 34 years |
| Scotch-Irish | 8.6 /100 | #212 | Tragic 5.7% |
| Immigrants | Immigrants | 7.1 /100 | #213 | Tragic 5.7% |
| Immigrants | Panama | 5.9 /100 | #214 | Tragic 5.7% |
| Immigrants | Cambodia | 5.8 /100 | #215 | Tragic 5.7% |
| Immigrants | Syria | 5.5 /100 | #216 | Tragic 5.7% |
| Immigrants | Fiji | 5.1 /100 | #217 | Tragic 5.7% |
| Panamanians | 4.5 /100 | #218 | Tragic 5.8% |
| French Canadians | 4.4 /100 | #219 | Tragic 5.8% |
| Sierra Leoneans | 3.9 /100 | #220 | Tragic 5.8% |
| Guamanians/Chamorros | 3.9 /100 | #221 | Tragic 5.8% |
| Spaniards | 3.2 /100 | #222 | Tragic 5.8% |
| Bermudans | 2.7 /100 | #223 | Tragic 5.8% |
| Slovaks | 2.5 /100 | #224 | Tragic 5.8% |
| Samoans | 2.5 /100 | #225 | Tragic 5.8% |
| Liberians | 2.3 /100 | #226 | Tragic 5.8% |
| Spanish | 1.8 /100 | #227 | Tragic 5.8% |
| Immigrants | Bahamas | 1.8 /100 | #228 | Tragic 5.8% |
| Immigrants | Uzbekistan | 1.5 /100 | #229 | Tragic 5.9% |
| Hawaiians | 1.2 /100 | #230 | Tragic 5.9% |
| Japanese | 1.1 /100 | #231 | Tragic 5.9% |
| Iroquois | 1.0 /100 | #232 | Tragic 5.9% |