Immigrants from Zaire vs Immigrants from Ukraine 1 or more Vehicles in Household
COMPARE
Immigrants from Zaire
Immigrants from Ukraine
1 or more Vehicles in Household
1 or more Vehicles in Household Comparison
Immigrants from Zaire
Immigrants from Ukraine
88.8%
1 OR MORE VEHICLES IN HOUSEHOLD
8.1/ 100
METRIC RATING
220th/ 347
METRIC RANK
85.2%
1 OR MORE VEHICLES IN HOUSEHOLD
0.0/ 100
METRIC RATING
304th/ 347
METRIC RANK
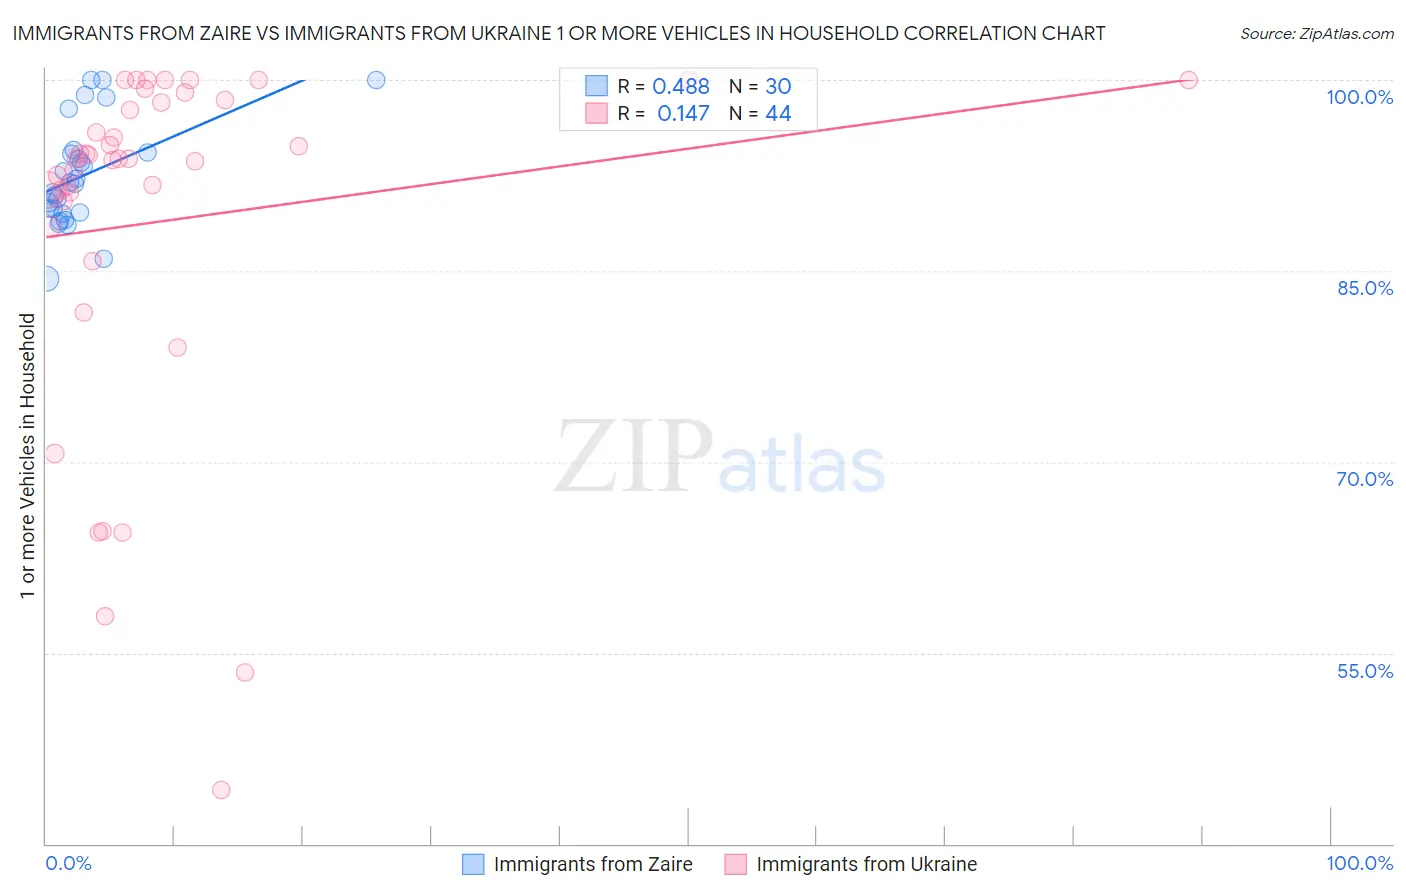
Immigrants from Zaire vs Immigrants from Ukraine 1 or more Vehicles in Household Correlation Chart
The statistical analysis conducted on geographies consisting of 107,246,664 people shows a moderate positive correlation between the proportion of Immigrants from Zaire and percentage of households with 1 or more vehicles available in the United States with a correlation coefficient (R) of 0.488 and weighted average of 88.8%. Similarly, the statistical analysis conducted on geographies consisting of 289,657,914 people shows a poor positive correlation between the proportion of Immigrants from Ukraine and percentage of households with 1 or more vehicles available in the United States with a correlation coefficient (R) of 0.147 and weighted average of 85.2%, a difference of 4.3%.
1 or more Vehicles in Household Correlation Summary
| Measurement | Immigrants from Zaire | Immigrants from Ukraine |
| Minimum | 84.4% | 44.2% |
| Maximum | 100.0% | 100.0% |
| Range | 15.6% | 55.8% |
| Mean | 92.5% | 88.9% |
| Median | 91.9% | 93.8% |
| Interquartile 25% (IQ1) | 89.6% | 89.5% |
| Interquartile 75% (IQ3) | 94.4% | 98.4% |
| Interquartile Range (IQR) | 4.8% | 8.9% |
| Standard Deviation (Sample) | 4.1% | 14.0% |
| Standard Deviation (Population) | 4.1% | 13.8% |
Similar Demographics by 1 or more Vehicles in Household
Demographics Similar to Immigrants from Zaire by 1 or more Vehicles in Household
In terms of 1 or more vehicles in household, the demographic groups most similar to Immigrants from Zaire are Peruvian (88.8%, a difference of 0.010%), Ugandan (88.9%, a difference of 0.030%), Immigrants from Guatemala (88.9%, a difference of 0.030%), Argentinean (88.9%, a difference of 0.040%), and Immigrants from Argentina (88.9%, a difference of 0.070%).
| Demographics | Rating | Rank | 1 or more Vehicles in Household |
| Immigrants | Western Asia | 12.3 /100 | #213 | Poor 89.0% |
| Immigrants | Hungary | 11.9 /100 | #214 | Poor 89.0% |
| Immigrants | Sri Lanka | 10.2 /100 | #215 | Poor 88.9% |
| Immigrants | Argentina | 9.4 /100 | #216 | Tragic 88.9% |
| Argentineans | 8.8 /100 | #217 | Tragic 88.9% |
| Ugandans | 8.7 /100 | #218 | Tragic 88.9% |
| Immigrants | Guatemala | 8.6 /100 | #219 | Tragic 88.9% |
| Immigrants | Zaire | 8.1 /100 | #220 | Tragic 88.8% |
| Peruvians | 7.9 /100 | #221 | Tragic 88.8% |
| Uruguayans | 7.0 /100 | #222 | Tragic 88.8% |
| Immigrants | South America | 7.0 /100 | #223 | Tragic 88.8% |
| Immigrants | Hong Kong | 6.2 /100 | #224 | Tragic 88.7% |
| Cree | 6.0 /100 | #225 | Tragic 88.7% |
| Cheyenne | 5.7 /100 | #226 | Tragic 88.7% |
| Ute | 5.6 /100 | #227 | Tragic 88.7% |
Demographics Similar to Immigrants from Ukraine by 1 or more Vehicles in Household
In terms of 1 or more vehicles in household, the demographic groups most similar to Immigrants from Ukraine are Immigrants from Greece (85.4%, a difference of 0.17%), Moroccan (85.4%, a difference of 0.20%), Immigrants from Panama (85.4%, a difference of 0.22%), Yuman (85.5%, a difference of 0.26%), and Immigrants from Russia (85.4%, a difference of 0.26%).
| Demographics | Rating | Rank | 1 or more Vehicles in Household |
| Paraguayans | 0.0 /100 | #297 | Tragic 85.7% |
| Belizeans | 0.0 /100 | #298 | Tragic 85.7% |
| Yuman | 0.0 /100 | #299 | Tragic 85.5% |
| Immigrants | Russia | 0.0 /100 | #300 | Tragic 85.4% |
| Immigrants | Panama | 0.0 /100 | #301 | Tragic 85.4% |
| Moroccans | 0.0 /100 | #302 | Tragic 85.4% |
| Immigrants | Greece | 0.0 /100 | #303 | Tragic 85.4% |
| Immigrants | Ukraine | 0.0 /100 | #304 | Tragic 85.2% |
| Immigrants | China | 0.0 /100 | #305 | Tragic 84.9% |
| Immigrants | Western Africa | 0.0 /100 | #306 | Tragic 84.9% |
| Tohono O'odham | 0.0 /100 | #307 | Tragic 84.7% |
| Immigrants | Belize | 0.0 /100 | #308 | Tragic 84.7% |
| Immigrants | Haiti | 0.0 /100 | #309 | Tragic 84.7% |
| U.S. Virgin Islanders | 0.0 /100 | #310 | Tragic 84.6% |
| Puerto Ricans | 0.0 /100 | #311 | Tragic 84.6% |