Immigrants from Zaire vs Immigrants from Ukraine 8th Grade
COMPARE
Immigrants from Zaire
Immigrants from Ukraine
8th Grade
8th Grade Comparison
Immigrants from Zaire
Immigrants from Ukraine
95.6%
8TH GRADE
25.2/ 100
METRIC RATING
195th/ 347
METRIC RANK
95.8%
8TH GRADE
59.5/ 100
METRIC RATING
168th/ 347
METRIC RANK
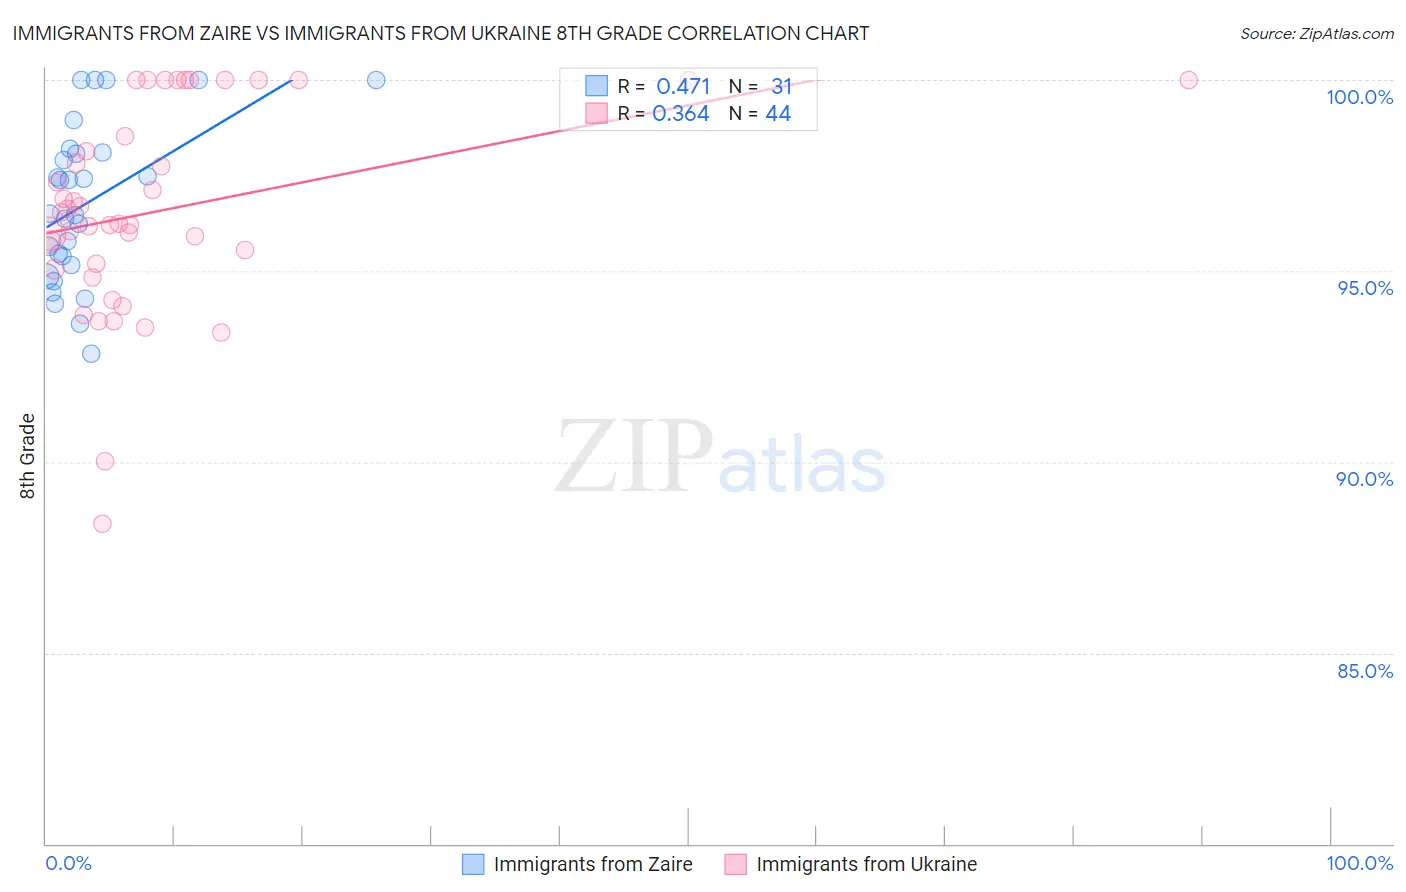
Immigrants from Zaire vs Immigrants from Ukraine 8th Grade Correlation Chart
The statistical analysis conducted on geographies consisting of 107,212,695 people shows a moderate positive correlation between the proportion of Immigrants from Zaire and percentage of population with at least 8th grade education in the United States with a correlation coefficient (R) of 0.471 and weighted average of 95.6%. Similarly, the statistical analysis conducted on geographies consisting of 289,712,791 people shows a mild positive correlation between the proportion of Immigrants from Ukraine and percentage of population with at least 8th grade education in the United States with a correlation coefficient (R) of 0.364 and weighted average of 95.8%, a difference of 0.24%.
8th Grade Correlation Summary
| Measurement | Immigrants from Zaire | Immigrants from Ukraine |
| Minimum | 92.8% | 88.4% |
| Maximum | 100.0% | 100.0% |
| Range | 7.2% | 11.6% |
| Mean | 96.8% | 96.6% |
| Median | 96.5% | 96.4% |
| Interquartile 25% (IQ1) | 95.2% | 95.1% |
| Interquartile 75% (IQ3) | 98.1% | 99.3% |
| Interquartile Range (IQR) | 2.9% | 4.2% |
| Standard Deviation (Sample) | 2.1% | 2.7% |
| Standard Deviation (Population) | 2.0% | 2.7% |
Similar Demographics by 8th Grade
Demographics Similar to Immigrants from Zaire by 8th Grade
In terms of 8th grade, the demographic groups most similar to Immigrants from Zaire are Guamanian/Chamorro (95.6%, a difference of 0.010%), Assyrian/Chaldean/Syriac (95.6%, a difference of 0.010%), Sierra Leonean (95.6%, a difference of 0.010%), Paraguayan (95.5%, a difference of 0.020%), and Immigrants from Northern Africa (95.5%, a difference of 0.020%).
| Demographics | Rating | Rank | 8th Grade |
| Liberians | 32.4 /100 | #188 | Fair 95.6% |
| Immigrants | Micronesia | 31.6 /100 | #189 | Fair 95.6% |
| Immigrants | Venezuela | 30.8 /100 | #190 | Fair 95.6% |
| Immigrants | Nepal | 30.2 /100 | #191 | Fair 95.6% |
| Pima | 28.6 /100 | #192 | Fair 95.6% |
| Panamanians | 28.4 /100 | #193 | Fair 95.6% |
| Guamanians/Chamorros | 26.6 /100 | #194 | Fair 95.6% |
| Immigrants | Zaire | 25.2 /100 | #195 | Fair 95.6% |
| Assyrians/Chaldeans/Syriacs | 24.5 /100 | #196 | Fair 95.6% |
| Sierra Leoneans | 24.3 /100 | #197 | Fair 95.6% |
| Paraguayans | 22.6 /100 | #198 | Fair 95.5% |
| Immigrants | Northern Africa | 22.5 /100 | #199 | Fair 95.5% |
| Argentineans | 22.2 /100 | #200 | Fair 95.5% |
| Immigrants | Argentina | 20.6 /100 | #201 | Fair 95.5% |
| Apache | 19.4 /100 | #202 | Poor 95.5% |
Demographics Similar to Immigrants from Ukraine by 8th Grade
In terms of 8th grade, the demographic groups most similar to Immigrants from Ukraine are Spaniard (95.8%, a difference of 0.0%), Alsatian (95.8%, a difference of 0.010%), Immigrants from Poland (95.8%, a difference of 0.010%), Immigrants from Iran (95.8%, a difference of 0.010%), and Ute (95.8%, a difference of 0.010%).
| Demographics | Rating | Rank | 8th Grade |
| Bermudans | 67.5 /100 | #161 | Good 95.8% |
| Immigrants | Kenya | 67.2 /100 | #162 | Good 95.8% |
| Immigrants | Sri Lanka | 64.1 /100 | #163 | Good 95.8% |
| Immigrants | Italy | 63.5 /100 | #164 | Good 95.8% |
| Alsatians | 61.4 /100 | #165 | Good 95.8% |
| Immigrants | Poland | 61.1 /100 | #166 | Good 95.8% |
| Spaniards | 60.0 /100 | #167 | Good 95.8% |
| Immigrants | Ukraine | 59.5 /100 | #168 | Average 95.8% |
| Immigrants | Iran | 58.6 /100 | #169 | Average 95.8% |
| Ute | 58.5 /100 | #170 | Average 95.8% |
| Egyptians | 58.2 /100 | #171 | Average 95.8% |
| Immigrants | Korea | 57.9 /100 | #172 | Average 95.8% |
| Mongolians | 53.0 /100 | #173 | Average 95.8% |
| Chileans | 50.0 /100 | #174 | Average 95.7% |
| Immigrants | Albania | 49.6 /100 | #175 | Average 95.7% |