Navajo vs Immigrants from Ukraine 1 or more Vehicles in Household
COMPARE
Navajo
Immigrants from Ukraine
1 or more Vehicles in Household
1 or more Vehicles in Household Comparison
Navajo
Immigrants from Ukraine
90.8%
1 OR MORE VEHICLES IN HOUSEHOLD
95.8/ 100
METRIC RATING
111th/ 347
METRIC RANK
85.2%
1 OR MORE VEHICLES IN HOUSEHOLD
0.0/ 100
METRIC RATING
304th/ 347
METRIC RANK
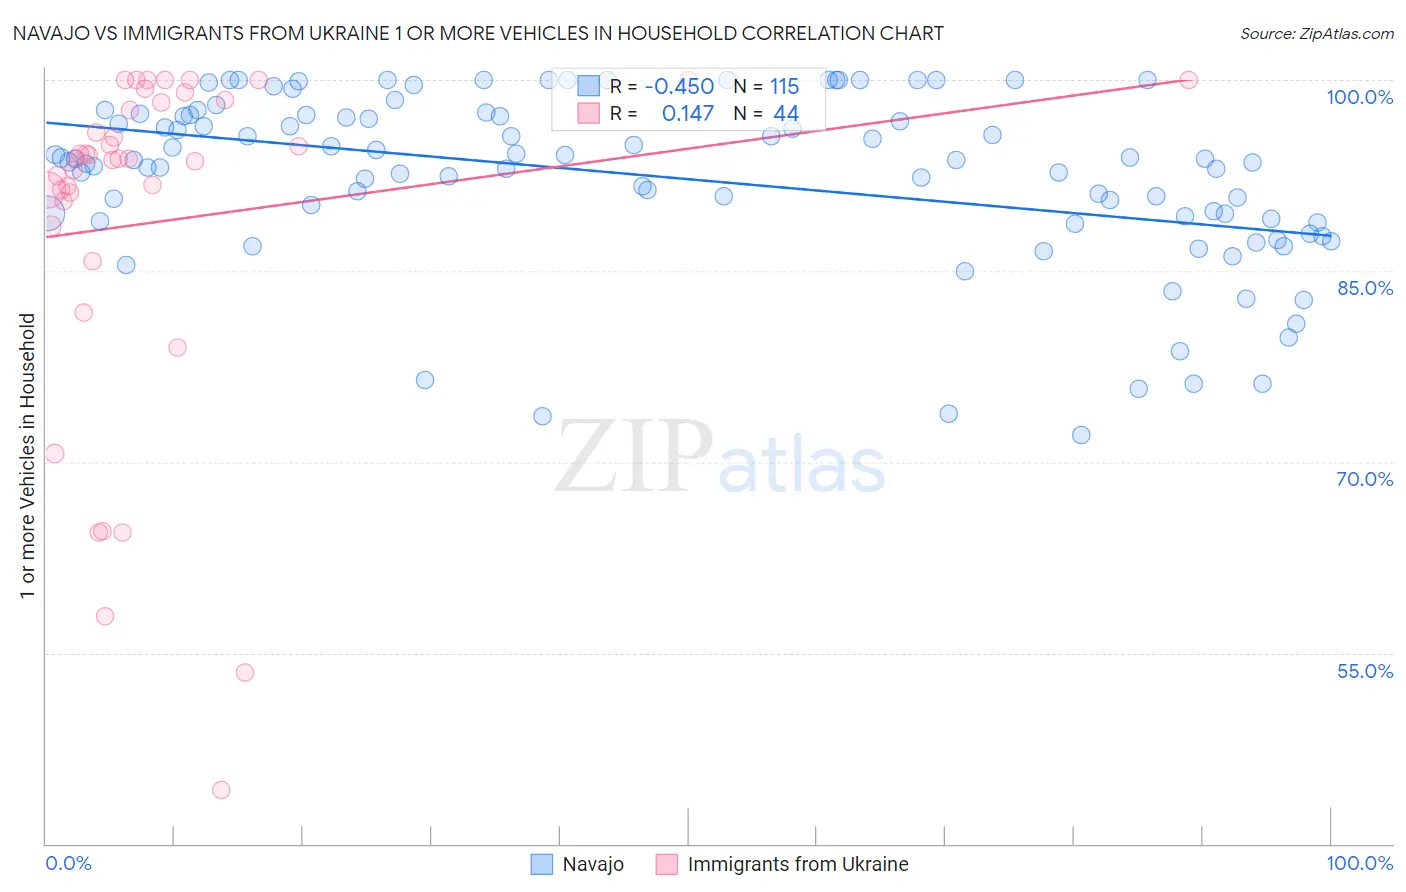
Navajo vs Immigrants from Ukraine 1 or more Vehicles in Household Correlation Chart
The statistical analysis conducted on geographies consisting of 224,767,823 people shows a moderate negative correlation between the proportion of Navajo and percentage of households with 1 or more vehicles available in the United States with a correlation coefficient (R) of -0.450 and weighted average of 90.8%. Similarly, the statistical analysis conducted on geographies consisting of 289,657,914 people shows a poor positive correlation between the proportion of Immigrants from Ukraine and percentage of households with 1 or more vehicles available in the United States with a correlation coefficient (R) of 0.147 and weighted average of 85.2%, a difference of 6.5%.
1 or more Vehicles in Household Correlation Summary
| Measurement | Navajo | Immigrants from Ukraine |
| Minimum | 72.1% | 44.2% |
| Maximum | 100.0% | 100.0% |
| Range | 27.9% | 55.8% |
| Mean | 92.4% | 88.9% |
| Median | 93.7% | 93.8% |
| Interquartile 25% (IQ1) | 89.1% | 89.5% |
| Interquartile 75% (IQ3) | 97.2% | 98.4% |
| Interquartile Range (IQR) | 8.2% | 8.9% |
| Standard Deviation (Sample) | 6.7% | 14.0% |
| Standard Deviation (Population) | 6.7% | 13.8% |
Similar Demographics by 1 or more Vehicles in Household
Demographics Similar to Navajo by 1 or more Vehicles in Household
In terms of 1 or more vehicles in household, the demographic groups most similar to Navajo are Immigrants from Netherlands (90.8%, a difference of 0.010%), Immigrants from Kuwait (90.7%, a difference of 0.090%), Armenian (90.7%, a difference of 0.11%), Serbian (90.7%, a difference of 0.12%), and Chippewa (90.7%, a difference of 0.13%).
| Demographics | Rating | Rank | 1 or more Vehicles in Household |
| Asians | 98.2 /100 | #104 | Exceptional 91.1% |
| Laotians | 98.0 /100 | #105 | Exceptional 91.0% |
| Zimbabweans | 97.7 /100 | #106 | Exceptional 91.0% |
| Maltese | 97.7 /100 | #107 | Exceptional 91.0% |
| Hispanics or Latinos | 97.6 /100 | #108 | Exceptional 91.0% |
| Delaware | 97.6 /100 | #109 | Exceptional 91.0% |
| Mexican American Indians | 97.4 /100 | #110 | Exceptional 91.0% |
| Navajo | 95.8 /100 | #111 | Exceptional 90.8% |
| Immigrants | Netherlands | 95.7 /100 | #112 | Exceptional 90.8% |
| Immigrants | Kuwait | 94.7 /100 | #113 | Exceptional 90.7% |
| Armenians | 94.5 /100 | #114 | Exceptional 90.7% |
| Serbians | 94.3 /100 | #115 | Exceptional 90.7% |
| Chippewa | 94.3 /100 | #116 | Exceptional 90.7% |
| Greeks | 93.5 /100 | #117 | Exceptional 90.6% |
| Japanese | 93.4 /100 | #118 | Exceptional 90.6% |
Demographics Similar to Immigrants from Ukraine by 1 or more Vehicles in Household
In terms of 1 or more vehicles in household, the demographic groups most similar to Immigrants from Ukraine are Immigrants from Greece (85.4%, a difference of 0.17%), Moroccan (85.4%, a difference of 0.20%), Immigrants from Panama (85.4%, a difference of 0.22%), Yuman (85.5%, a difference of 0.26%), and Immigrants from Russia (85.4%, a difference of 0.26%).
| Demographics | Rating | Rank | 1 or more Vehicles in Household |
| Paraguayans | 0.0 /100 | #297 | Tragic 85.7% |
| Belizeans | 0.0 /100 | #298 | Tragic 85.7% |
| Yuman | 0.0 /100 | #299 | Tragic 85.5% |
| Immigrants | Russia | 0.0 /100 | #300 | Tragic 85.4% |
| Immigrants | Panama | 0.0 /100 | #301 | Tragic 85.4% |
| Moroccans | 0.0 /100 | #302 | Tragic 85.4% |
| Immigrants | Greece | 0.0 /100 | #303 | Tragic 85.4% |
| Immigrants | Ukraine | 0.0 /100 | #304 | Tragic 85.2% |
| Immigrants | China | 0.0 /100 | #305 | Tragic 84.9% |
| Immigrants | Western Africa | 0.0 /100 | #306 | Tragic 84.9% |
| Tohono O'odham | 0.0 /100 | #307 | Tragic 84.7% |
| Immigrants | Belize | 0.0 /100 | #308 | Tragic 84.7% |
| Immigrants | Haiti | 0.0 /100 | #309 | Tragic 84.7% |
| U.S. Virgin Islanders | 0.0 /100 | #310 | Tragic 84.6% |
| Puerto Ricans | 0.0 /100 | #311 | Tragic 84.6% |