Immigrants from Europe vs Immigrants from Ukraine 1 or more Vehicles in Household
COMPARE
Immigrants from Europe
Immigrants from Ukraine
1 or more Vehicles in Household
1 or more Vehicles in Household Comparison
Immigrants from Europe
Immigrants from Ukraine
87.6%
1 OR MORE VEHICLES IN HOUSEHOLD
0.2/ 100
METRIC RATING
268th/ 347
METRIC RANK
85.2%
1 OR MORE VEHICLES IN HOUSEHOLD
0.0/ 100
METRIC RATING
304th/ 347
METRIC RANK
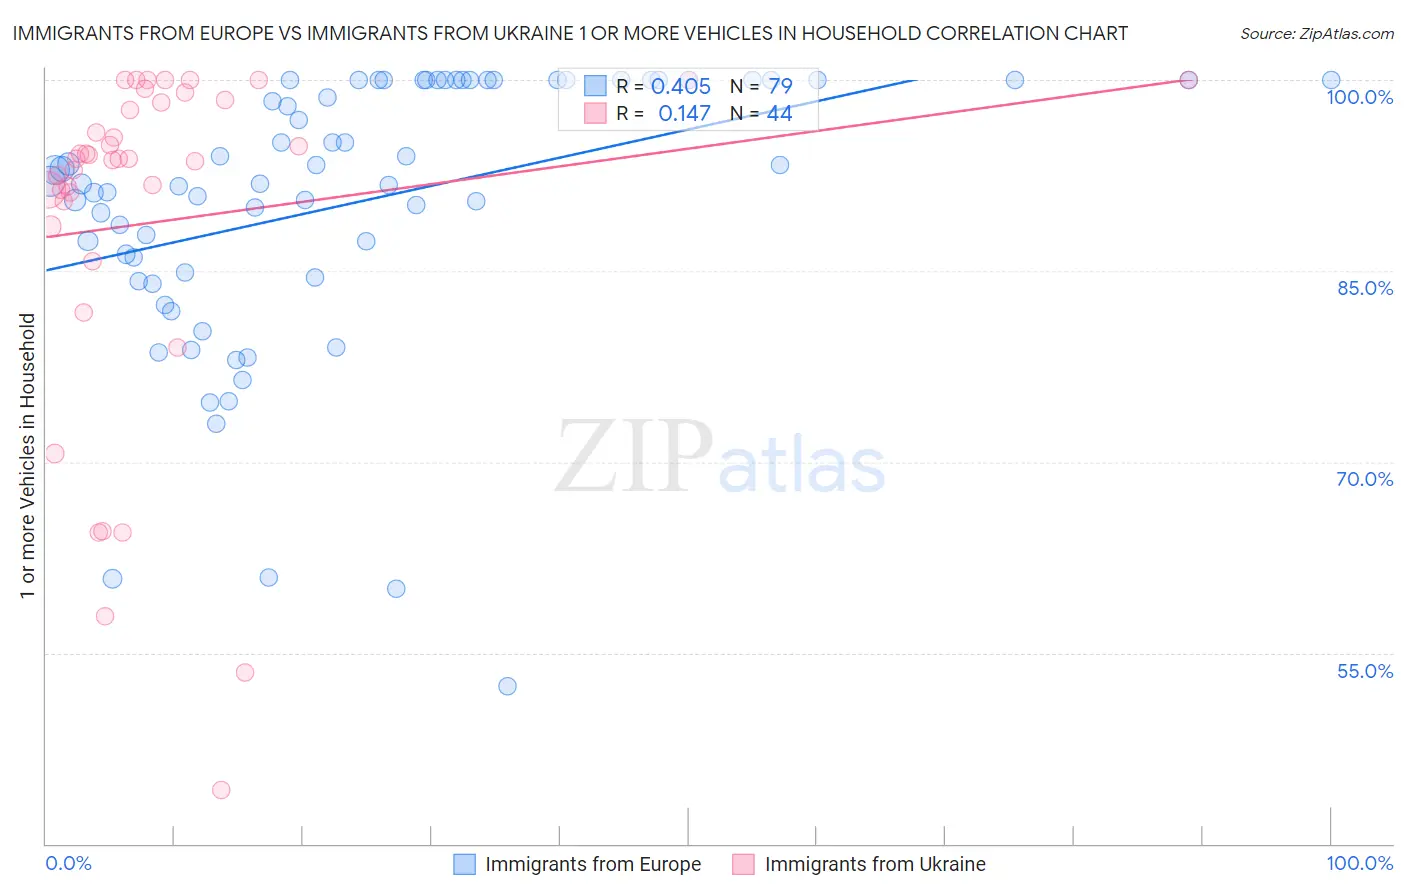
Immigrants from Europe vs Immigrants from Ukraine 1 or more Vehicles in Household Correlation Chart
The statistical analysis conducted on geographies consisting of 546,983,973 people shows a moderate positive correlation between the proportion of Immigrants from Europe and percentage of households with 1 or more vehicles available in the United States with a correlation coefficient (R) of 0.405 and weighted average of 87.6%. Similarly, the statistical analysis conducted on geographies consisting of 289,657,914 people shows a poor positive correlation between the proportion of Immigrants from Ukraine and percentage of households with 1 or more vehicles available in the United States with a correlation coefficient (R) of 0.147 and weighted average of 85.2%, a difference of 2.8%.
1 or more Vehicles in Household Correlation Summary
| Measurement | Immigrants from Europe | Immigrants from Ukraine |
| Minimum | 52.4% | 44.2% |
| Maximum | 100.0% | 100.0% |
| Range | 47.6% | 55.8% |
| Mean | 90.3% | 88.9% |
| Median | 92.1% | 93.8% |
| Interquartile 25% (IQ1) | 84.9% | 89.5% |
| Interquartile 75% (IQ3) | 100.0% | 98.4% |
| Interquartile Range (IQR) | 15.1% | 8.9% |
| Standard Deviation (Sample) | 10.7% | 14.0% |
| Standard Deviation (Population) | 10.6% | 13.8% |
Similar Demographics by 1 or more Vehicles in Household
Demographics Similar to Immigrants from Europe by 1 or more Vehicles in Household
In terms of 1 or more vehicles in household, the demographic groups most similar to Immigrants from Europe are Immigrants from Colombia (87.6%, a difference of 0.030%), Immigrants from Africa (87.6%, a difference of 0.050%), Panamanian (87.5%, a difference of 0.060%), Israeli (87.7%, a difference of 0.070%), and Bermudan (87.5%, a difference of 0.070%).
| Demographics | Rating | Rank | 1 or more Vehicles in Household |
| Immigrants | Switzerland | 0.6 /100 | #261 | Tragic 87.9% |
| Sub-Saharan Africans | 0.5 /100 | #262 | Tragic 87.9% |
| Immigrants | Egypt | 0.5 /100 | #263 | Tragic 87.8% |
| Immigrants | Liberia | 0.4 /100 | #264 | Tragic 87.8% |
| Africans | 0.4 /100 | #265 | Tragic 87.8% |
| Israelis | 0.3 /100 | #266 | Tragic 87.7% |
| Immigrants | Colombia | 0.3 /100 | #267 | Tragic 87.6% |
| Immigrants | Europe | 0.2 /100 | #268 | Tragic 87.6% |
| Immigrants | Africa | 0.2 /100 | #269 | Tragic 87.6% |
| Panamanians | 0.2 /100 | #270 | Tragic 87.5% |
| Bermudans | 0.2 /100 | #271 | Tragic 87.5% |
| Aleuts | 0.2 /100 | #272 | Tragic 87.5% |
| Immigrants | Northern Africa | 0.2 /100 | #273 | Tragic 87.4% |
| Immigrants | Morocco | 0.1 /100 | #274 | Tragic 87.4% |
| Immigrants | Singapore | 0.1 /100 | #275 | Tragic 87.2% |
Demographics Similar to Immigrants from Ukraine by 1 or more Vehicles in Household
In terms of 1 or more vehicles in household, the demographic groups most similar to Immigrants from Ukraine are Immigrants from Greece (85.4%, a difference of 0.17%), Moroccan (85.4%, a difference of 0.20%), Immigrants from Panama (85.4%, a difference of 0.22%), Yuman (85.5%, a difference of 0.26%), and Immigrants from Russia (85.4%, a difference of 0.26%).
| Demographics | Rating | Rank | 1 or more Vehicles in Household |
| Paraguayans | 0.0 /100 | #297 | Tragic 85.7% |
| Belizeans | 0.0 /100 | #298 | Tragic 85.7% |
| Yuman | 0.0 /100 | #299 | Tragic 85.5% |
| Immigrants | Russia | 0.0 /100 | #300 | Tragic 85.4% |
| Immigrants | Panama | 0.0 /100 | #301 | Tragic 85.4% |
| Moroccans | 0.0 /100 | #302 | Tragic 85.4% |
| Immigrants | Greece | 0.0 /100 | #303 | Tragic 85.4% |
| Immigrants | Ukraine | 0.0 /100 | #304 | Tragic 85.2% |
| Immigrants | China | 0.0 /100 | #305 | Tragic 84.9% |
| Immigrants | Western Africa | 0.0 /100 | #306 | Tragic 84.9% |
| Tohono O'odham | 0.0 /100 | #307 | Tragic 84.7% |
| Immigrants | Belize | 0.0 /100 | #308 | Tragic 84.7% |
| Immigrants | Haiti | 0.0 /100 | #309 | Tragic 84.7% |
| U.S. Virgin Islanders | 0.0 /100 | #310 | Tragic 84.6% |
| Puerto Ricans | 0.0 /100 | #311 | Tragic 84.6% |