Immigrants from Grenada vs Immigrants from Ukraine 1 or more Vehicles in Household
COMPARE
Immigrants from Grenada
Immigrants from Ukraine
1 or more Vehicles in Household
1 or more Vehicles in Household Comparison
Immigrants from Grenada
Immigrants from Ukraine
62.7%
1 OR MORE VEHICLES IN HOUSEHOLD
0.0/ 100
METRIC RATING
346th/ 347
METRIC RANK
85.2%
1 OR MORE VEHICLES IN HOUSEHOLD
0.0/ 100
METRIC RATING
304th/ 347
METRIC RANK
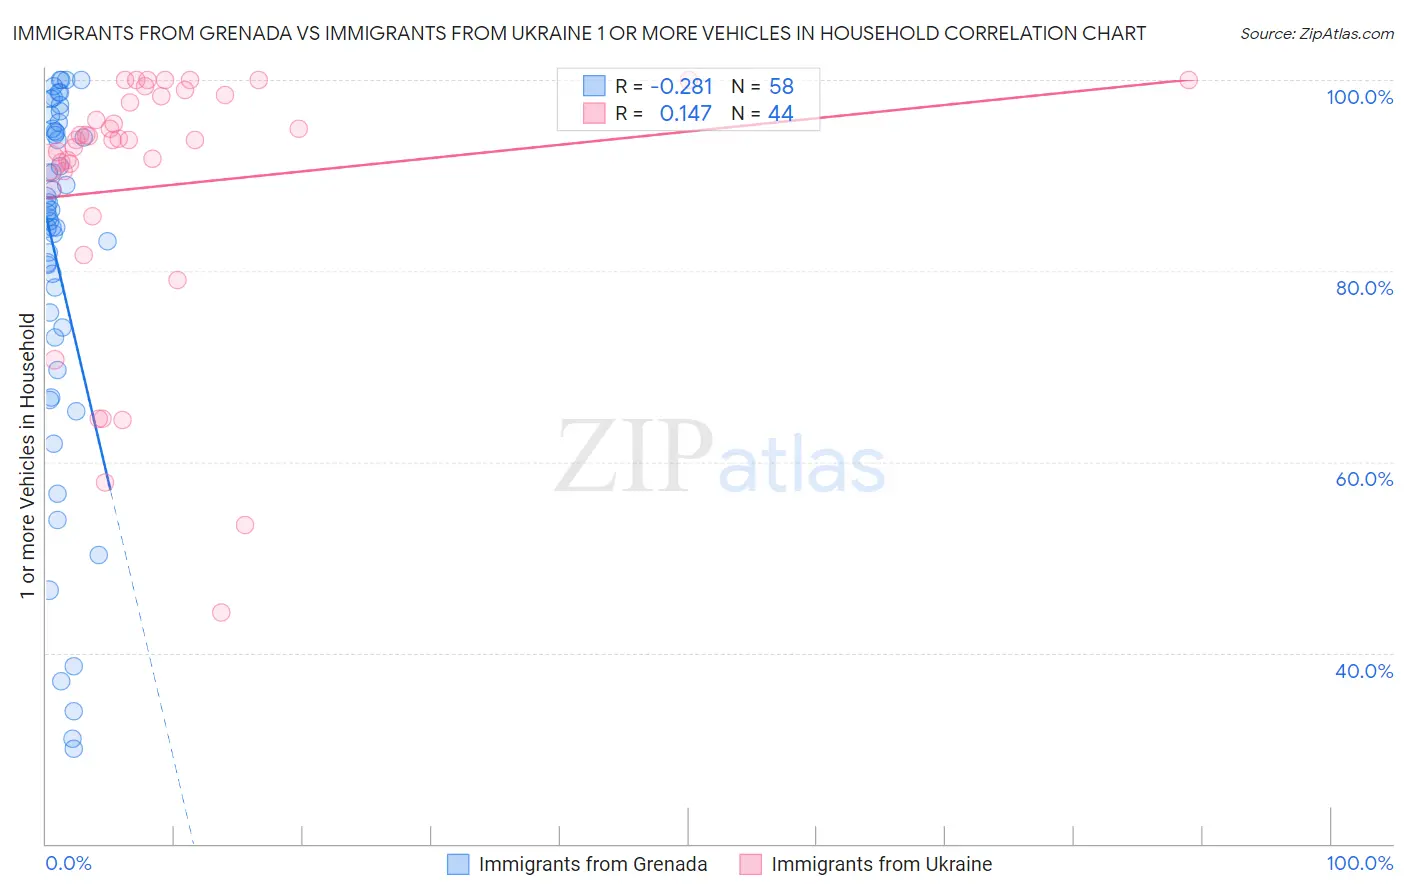
Immigrants from Grenada vs Immigrants from Ukraine 1 or more Vehicles in Household Correlation Chart
The statistical analysis conducted on geographies consisting of 67,200,374 people shows a weak negative correlation between the proportion of Immigrants from Grenada and percentage of households with 1 or more vehicles available in the United States with a correlation coefficient (R) of -0.281 and weighted average of 62.7%. Similarly, the statistical analysis conducted on geographies consisting of 289,657,914 people shows a poor positive correlation between the proportion of Immigrants from Ukraine and percentage of households with 1 or more vehicles available in the United States with a correlation coefficient (R) of 0.147 and weighted average of 85.2%, a difference of 36.0%.
1 or more Vehicles in Household Correlation Summary
| Measurement | Immigrants from Grenada | Immigrants from Ukraine |
| Minimum | 30.0% | 44.2% |
| Maximum | 100.0% | 100.0% |
| Range | 70.0% | 55.8% |
| Mean | 80.2% | 88.9% |
| Median | 85.9% | 93.8% |
| Interquartile 25% (IQ1) | 73.0% | 89.5% |
| Interquartile 75% (IQ3) | 94.7% | 98.4% |
| Interquartile Range (IQR) | 21.6% | 8.9% |
| Standard Deviation (Sample) | 19.4% | 14.0% |
| Standard Deviation (Population) | 19.2% | 13.8% |
Similar Demographics by 1 or more Vehicles in Household
Demographics Similar to Immigrants from Grenada by 1 or more Vehicles in Household
In terms of 1 or more vehicles in household, the demographic groups most similar to Immigrants from Grenada are Immigrants from St. Vincent and the Grenadines (64.7%, a difference of 3.2%), Yup'ik (58.4%, a difference of 7.2%), Immigrants from Dominican Republic (68.6%, a difference of 9.5%), British West Indian (70.4%, a difference of 12.2%), and Immigrants from Guyana (70.6%, a difference of 12.6%).
| Demographics | Rating | Rank | 1 or more Vehicles in Household |
| Immigrants | Ecuador | 0.0 /100 | #333 | Tragic 76.2% |
| Immigrants | Bangladesh | 0.0 /100 | #334 | Tragic 74.3% |
| Barbadians | 0.0 /100 | #335 | Tragic 74.0% |
| Vietnamese | 0.0 /100 | #336 | Tragic 73.8% |
| Immigrants | Uzbekistan | 0.0 /100 | #337 | Tragic 73.4% |
| Inupiat | 0.0 /100 | #338 | Tragic 71.5% |
| Guyanese | 0.0 /100 | #339 | Tragic 70.8% |
| Dominicans | 0.0 /100 | #340 | Tragic 70.7% |
| Immigrants | Barbados | 0.0 /100 | #341 | Tragic 70.6% |
| Immigrants | Guyana | 0.0 /100 | #342 | Tragic 70.6% |
| British West Indians | 0.0 /100 | #343 | Tragic 70.4% |
| Immigrants | Dominican Republic | 0.0 /100 | #344 | Tragic 68.6% |
| Immigrants | St. Vincent and the Grenadines | 0.0 /100 | #345 | Tragic 64.7% |
| Immigrants | Grenada | 0.0 /100 | #346 | Tragic 62.7% |
| Yup'ik | 0.0 /100 | #347 | Tragic 58.4% |
Demographics Similar to Immigrants from Ukraine by 1 or more Vehicles in Household
In terms of 1 or more vehicles in household, the demographic groups most similar to Immigrants from Ukraine are Immigrants from Greece (85.4%, a difference of 0.17%), Moroccan (85.4%, a difference of 0.20%), Immigrants from Panama (85.4%, a difference of 0.22%), Yuman (85.5%, a difference of 0.26%), and Immigrants from Russia (85.4%, a difference of 0.26%).
| Demographics | Rating | Rank | 1 or more Vehicles in Household |
| Paraguayans | 0.0 /100 | #297 | Tragic 85.7% |
| Belizeans | 0.0 /100 | #298 | Tragic 85.7% |
| Yuman | 0.0 /100 | #299 | Tragic 85.5% |
| Immigrants | Russia | 0.0 /100 | #300 | Tragic 85.4% |
| Immigrants | Panama | 0.0 /100 | #301 | Tragic 85.4% |
| Moroccans | 0.0 /100 | #302 | Tragic 85.4% |
| Immigrants | Greece | 0.0 /100 | #303 | Tragic 85.4% |
| Immigrants | Ukraine | 0.0 /100 | #304 | Tragic 85.2% |
| Immigrants | China | 0.0 /100 | #305 | Tragic 84.9% |
| Immigrants | Western Africa | 0.0 /100 | #306 | Tragic 84.9% |
| Tohono O'odham | 0.0 /100 | #307 | Tragic 84.7% |
| Immigrants | Belize | 0.0 /100 | #308 | Tragic 84.7% |
| Immigrants | Haiti | 0.0 /100 | #309 | Tragic 84.7% |
| U.S. Virgin Islanders | 0.0 /100 | #310 | Tragic 84.6% |
| Puerto Ricans | 0.0 /100 | #311 | Tragic 84.6% |