Immigrants from Venezuela vs Bolivian Cognitive Disability
COMPARE
Immigrants from Venezuela
Bolivian
Cognitive Disability
Cognitive Disability Comparison
Immigrants from Venezuela
Bolivians
16.5%
COGNITIVE DISABILITY
99.7/ 100
METRIC RATING
55th/ 347
METRIC RANK
16.5%
COGNITIVE DISABILITY
99.9/ 100
METRIC RATING
39th/ 347
METRIC RANK
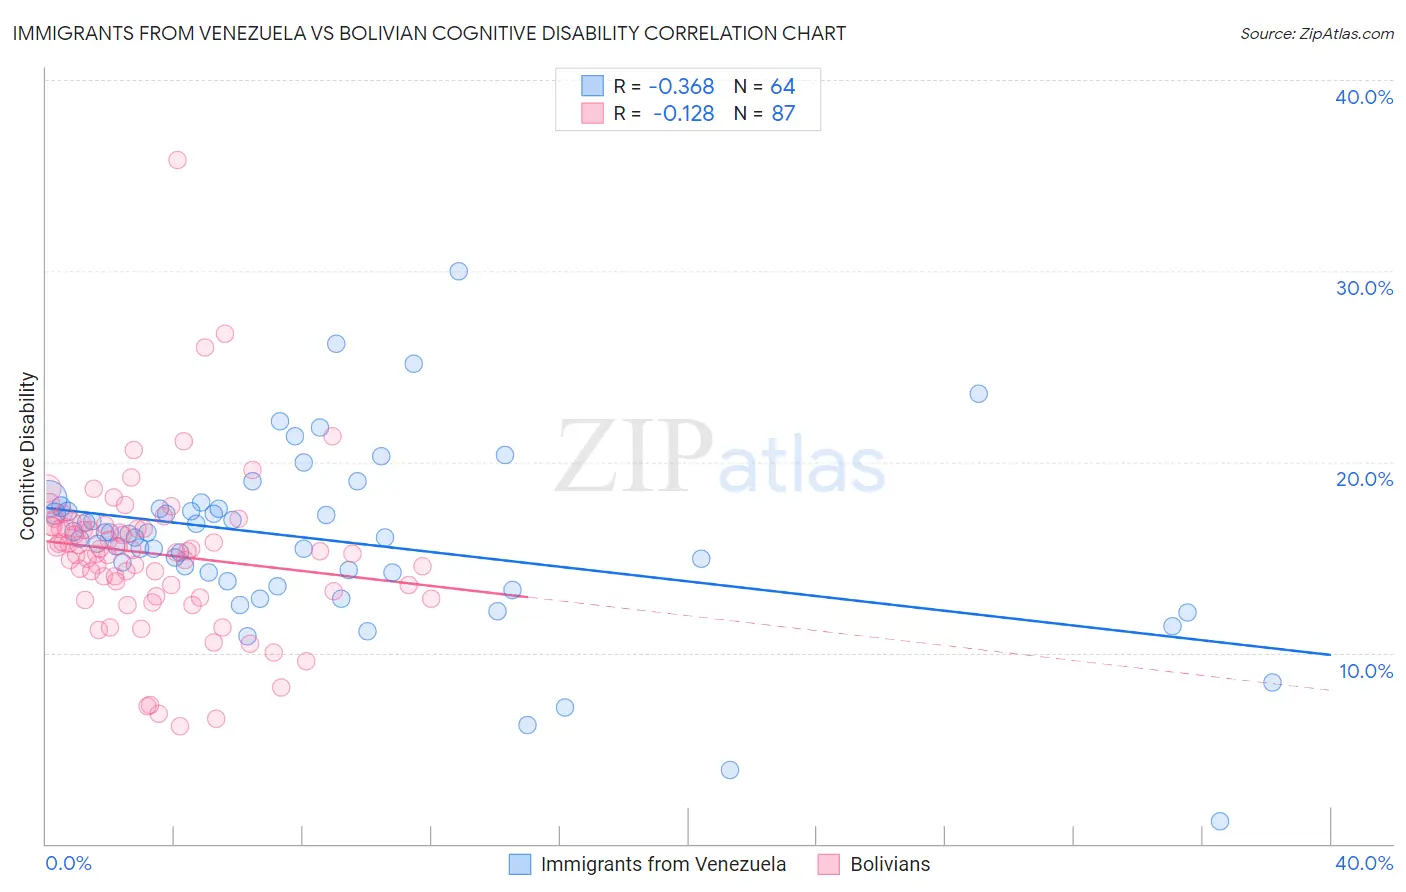
Immigrants from Venezuela vs Bolivian Cognitive Disability Correlation Chart
The statistical analysis conducted on geographies consisting of 287,845,766 people shows a mild negative correlation between the proportion of Immigrants from Venezuela and percentage of population with cognitive disability in the United States with a correlation coefficient (R) of -0.368 and weighted average of 16.5%. Similarly, the statistical analysis conducted on geographies consisting of 184,677,815 people shows a poor negative correlation between the proportion of Bolivians and percentage of population with cognitive disability in the United States with a correlation coefficient (R) of -0.128 and weighted average of 16.5%, a difference of 0.50%.
Cognitive Disability Correlation Summary
| Measurement | Immigrants from Venezuela | Bolivian |
| Minimum | 1.2% | 6.2% |
| Maximum | 30.0% | 35.8% |
| Range | 28.8% | 29.7% |
| Mean | 15.9% | 15.2% |
| Median | 16.1% | 15.3% |
| Interquartile 25% (IQ1) | 14.0% | 13.3% |
| Interquartile 75% (IQ3) | 17.6% | 16.6% |
| Interquartile Range (IQR) | 3.6% | 3.4% |
| Standard Deviation (Sample) | 4.7% | 4.2% |
| Standard Deviation (Population) | 4.7% | 4.2% |
Demographics Similar to Immigrants from Venezuela and Bolivians by Cognitive Disability
In terms of cognitive disability, the demographic groups most similar to Immigrants from Venezuela are Immigrants from Iran (16.5%, a difference of 0.090%), Austrian (16.6%, a difference of 0.090%), Bhutanese (16.6%, a difference of 0.10%), Swedish (16.5%, a difference of 0.13%), and Soviet Union (16.5%, a difference of 0.19%). Similarly, the demographic groups most similar to Bolivians are Immigrants from Belarus (16.5%, a difference of 0.010%), Cuban (16.5%, a difference of 0.020%), Hungarian (16.5%, a difference of 0.030%), Immigrants from Eastern Europe (16.5%, a difference of 0.070%), and Slovene (16.5%, a difference of 0.090%).
| Demographics | Rating | Rank | Cognitive Disability |
| Slovenes | 99.9 /100 | #37 | Exceptional 16.5% |
| Immigrants | Eastern Europe | 99.9 /100 | #38 | Exceptional 16.5% |
| Bolivians | 99.9 /100 | #39 | Exceptional 16.5% |
| Immigrants | Belarus | 99.9 /100 | #40 | Exceptional 16.5% |
| Cubans | 99.9 /100 | #41 | Exceptional 16.5% |
| Hungarians | 99.9 /100 | #42 | Exceptional 16.5% |
| Immigrants | Canada | 99.8 /100 | #43 | Exceptional 16.5% |
| Macedonians | 99.8 /100 | #44 | Exceptional 16.5% |
| Immigrants | Europe | 99.8 /100 | #45 | Exceptional 16.5% |
| Immigrants | Colombia | 99.8 /100 | #46 | Exceptional 16.5% |
| Immigrants | Italy | 99.8 /100 | #47 | Exceptional 16.5% |
| Immigrants | North America | 99.8 /100 | #48 | Exceptional 16.5% |
| Iranians | 99.8 /100 | #49 | Exceptional 16.5% |
| Norwegians | 99.8 /100 | #50 | Exceptional 16.5% |
| Immigrants | Korea | 99.8 /100 | #51 | Exceptional 16.5% |
| Soviet Union | 99.8 /100 | #52 | Exceptional 16.5% |
| Swedes | 99.8 /100 | #53 | Exceptional 16.5% |
| Immigrants | Iran | 99.8 /100 | #54 | Exceptional 16.5% |
| Immigrants | Venezuela | 99.7 /100 | #55 | Exceptional 16.5% |
| Austrians | 99.7 /100 | #56 | Exceptional 16.6% |
| Bhutanese | 99.7 /100 | #57 | Exceptional 16.6% |