Immigrants from Uzbekistan vs Native/Alaskan 1 or more Vehicles in Household
COMPARE
Immigrants from Uzbekistan
Native/Alaskan
1 or more Vehicles in Household
1 or more Vehicles in Household Comparison
Immigrants from Uzbekistan
Natives/Alaskans
73.4%
1 OR MORE VEHICLES IN HOUSEHOLD
0.0/ 100
METRIC RATING
337th/ 347
METRIC RANK
89.8%
1 OR MORE VEHICLES IN HOUSEHOLD
59.5/ 100
METRIC RATING
169th/ 347
METRIC RANK
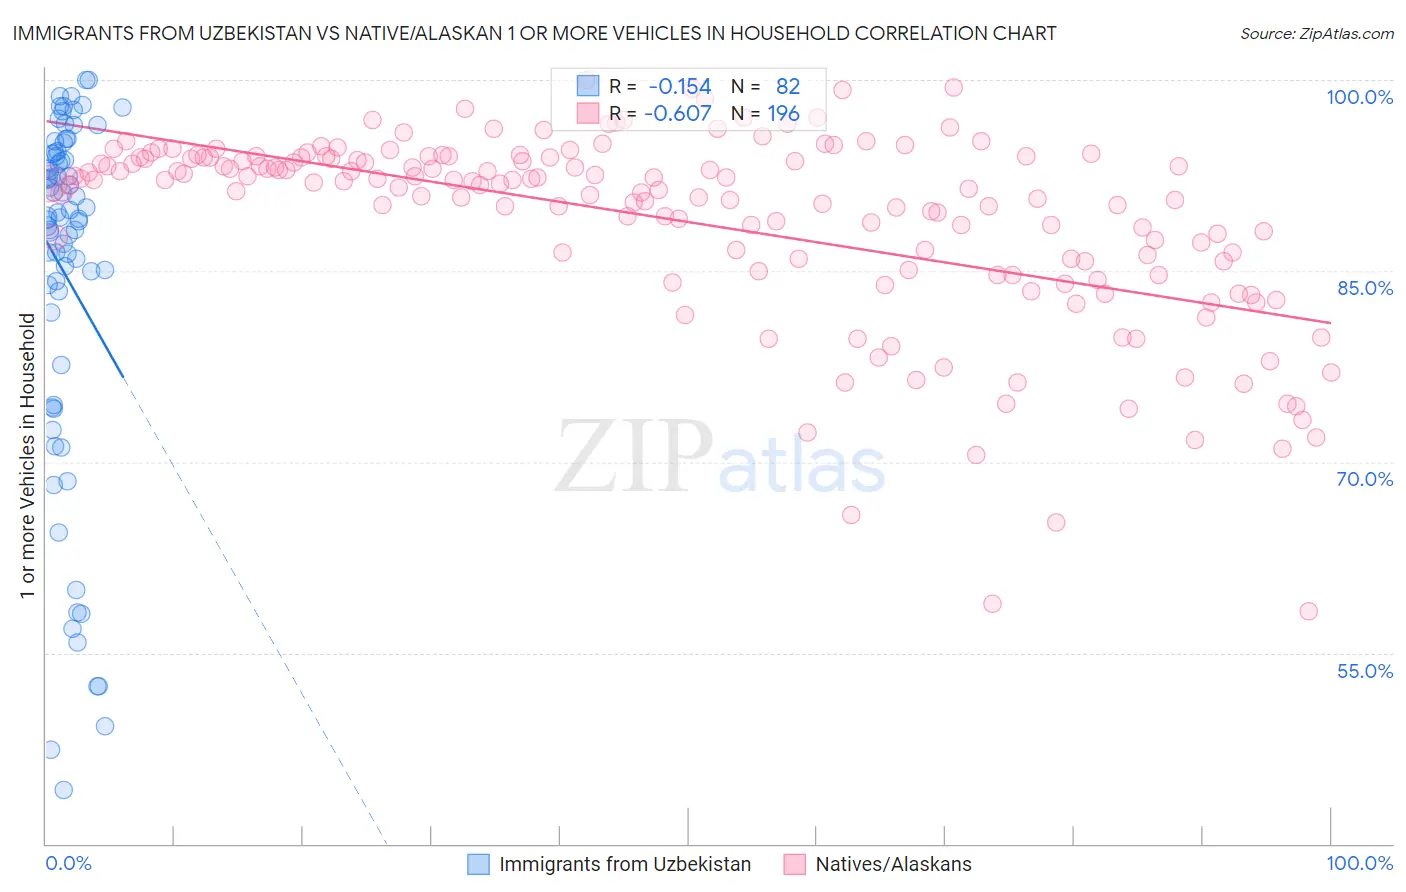
Immigrants from Uzbekistan vs Native/Alaskan 1 or more Vehicles in Household Correlation Chart
The statistical analysis conducted on geographies consisting of 118,706,562 people shows a poor negative correlation between the proportion of Immigrants from Uzbekistan and percentage of households with 1 or more vehicles available in the United States with a correlation coefficient (R) of -0.154 and weighted average of 73.4%. Similarly, the statistical analysis conducted on geographies consisting of 512,700,478 people shows a significant negative correlation between the proportion of Natives/Alaskans and percentage of households with 1 or more vehicles available in the United States with a correlation coefficient (R) of -0.607 and weighted average of 89.8%, a difference of 22.4%.
1 or more Vehicles in Household Correlation Summary
| Measurement | Immigrants from Uzbekistan | Native/Alaskan |
| Minimum | 44.2% | 58.3% |
| Maximum | 100.0% | 100.0% |
| Range | 55.8% | 41.7% |
| Mean | 84.6% | 88.9% |
| Median | 89.2% | 91.8% |
| Interquartile 25% (IQ1) | 81.7% | 85.8% |
| Interquartile 75% (IQ3) | 94.2% | 93.9% |
| Interquartile Range (IQR) | 12.4% | 8.1% |
| Standard Deviation (Sample) | 14.2% | 7.6% |
| Standard Deviation (Population) | 14.1% | 7.6% |
Similar Demographics by 1 or more Vehicles in Household
Demographics Similar to Immigrants from Uzbekistan by 1 or more Vehicles in Household
In terms of 1 or more vehicles in household, the demographic groups most similar to Immigrants from Uzbekistan are Vietnamese (73.8%, a difference of 0.62%), Barbadian (74.0%, a difference of 0.82%), Immigrants from Bangladesh (74.3%, a difference of 1.3%), Inupiat (71.5%, a difference of 2.6%), and Guyanese (70.8%, a difference of 3.6%).
| Demographics | Rating | Rank | 1 or more Vehicles in Household |
| Immigrants | Trinidad and Tobago | 0.0 /100 | #330 | Tragic 76.8% |
| West Indians | 0.0 /100 | #331 | Tragic 76.4% |
| Trinidadians and Tobagonians | 0.0 /100 | #332 | Tragic 76.3% |
| Immigrants | Ecuador | 0.0 /100 | #333 | Tragic 76.2% |
| Immigrants | Bangladesh | 0.0 /100 | #334 | Tragic 74.3% |
| Barbadians | 0.0 /100 | #335 | Tragic 74.0% |
| Vietnamese | 0.0 /100 | #336 | Tragic 73.8% |
| Immigrants | Uzbekistan | 0.0 /100 | #337 | Tragic 73.4% |
| Inupiat | 0.0 /100 | #338 | Tragic 71.5% |
| Guyanese | 0.0 /100 | #339 | Tragic 70.8% |
| Dominicans | 0.0 /100 | #340 | Tragic 70.7% |
| Immigrants | Barbados | 0.0 /100 | #341 | Tragic 70.6% |
| Immigrants | Guyana | 0.0 /100 | #342 | Tragic 70.6% |
| British West Indians | 0.0 /100 | #343 | Tragic 70.4% |
| Immigrants | Dominican Republic | 0.0 /100 | #344 | Tragic 68.6% |
Demographics Similar to Natives/Alaskans by 1 or more Vehicles in Household
In terms of 1 or more vehicles in household, the demographic groups most similar to Natives/Alaskans are Immigrants from Latin America (89.8%, a difference of 0.010%), Immigrants from Cambodia (89.8%, a difference of 0.010%), Immigrants from Costa Rica (89.8%, a difference of 0.030%), Immigrants from Middle Africa (89.9%, a difference of 0.040%), and Immigrants from Saudi Arabia (89.9%, a difference of 0.050%).
| Demographics | Rating | Rank | 1 or more Vehicles in Household |
| Spanish American Indians | 67.0 /100 | #162 | Good 89.9% |
| Immigrants | Austria | 65.5 /100 | #163 | Good 89.9% |
| Comanche | 63.4 /100 | #164 | Good 89.9% |
| Immigrants | Saudi Arabia | 62.6 /100 | #165 | Good 89.9% |
| Immigrants | Middle Africa | 62.2 /100 | #166 | Good 89.9% |
| Immigrants | Latin America | 60.3 /100 | #167 | Good 89.8% |
| Immigrants | Cambodia | 60.1 /100 | #168 | Good 89.8% |
| Natives/Alaskans | 59.5 /100 | #169 | Average 89.8% |
| Immigrants | Costa Rica | 57.6 /100 | #170 | Average 89.8% |
| French American Indians | 54.4 /100 | #171 | Average 89.8% |
| Indonesians | 53.0 /100 | #172 | Average 89.7% |
| Lumbee | 52.8 /100 | #173 | Average 89.7% |
| Filipinos | 50.0 /100 | #174 | Average 89.7% |
| Immigrants | Burma/Myanmar | 47.6 /100 | #175 | Average 89.7% |
| Immigrants | Sudan | 47.1 /100 | #176 | Average 89.7% |