Immigrants from Uzbekistan vs Basque 1 or more Vehicles in Household
COMPARE
Immigrants from Uzbekistan
Basque
1 or more Vehicles in Household
1 or more Vehicles in Household Comparison
Immigrants from Uzbekistan
Basques
73.4%
1 OR MORE VEHICLES IN HOUSEHOLD
0.0/ 100
METRIC RATING
337th/ 347
METRIC RANK
92.4%
1 OR MORE VEHICLES IN HOUSEHOLD
100.0/ 100
METRIC RATING
32nd/ 347
METRIC RANK
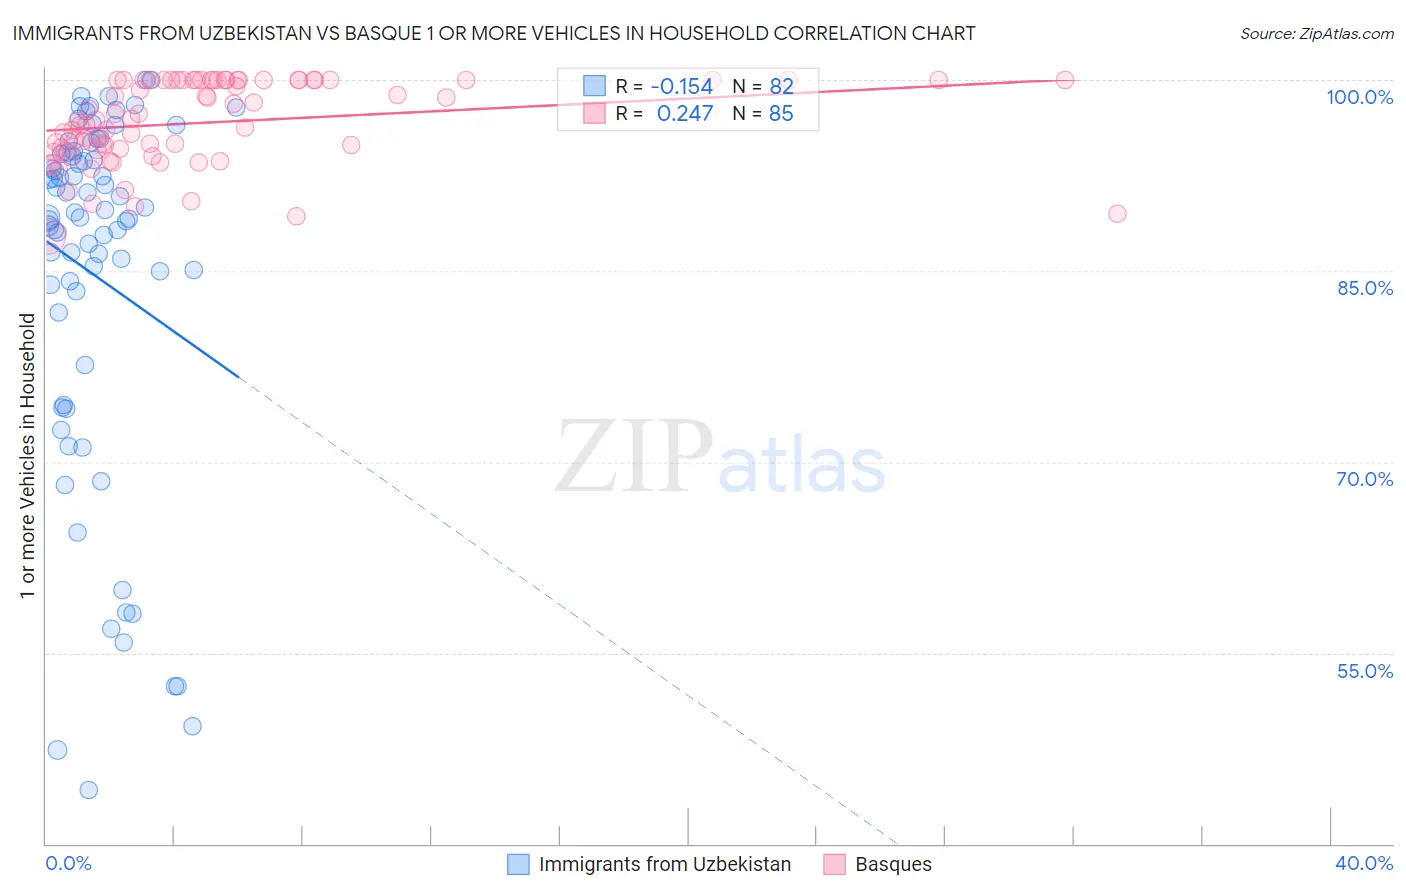
Immigrants from Uzbekistan vs Basque 1 or more Vehicles in Household Correlation Chart
The statistical analysis conducted on geographies consisting of 118,706,562 people shows a poor negative correlation between the proportion of Immigrants from Uzbekistan and percentage of households with 1 or more vehicles available in the United States with a correlation coefficient (R) of -0.154 and weighted average of 73.4%. Similarly, the statistical analysis conducted on geographies consisting of 165,757,280 people shows a weak positive correlation between the proportion of Basques and percentage of households with 1 or more vehicles available in the United States with a correlation coefficient (R) of 0.247 and weighted average of 92.4%, a difference of 25.9%.
1 or more Vehicles in Household Correlation Summary
| Measurement | Immigrants from Uzbekistan | Basque |
| Minimum | 44.2% | 87.7% |
| Maximum | 100.0% | 100.0% |
| Range | 55.8% | 12.3% |
| Mean | 84.6% | 96.7% |
| Median | 89.2% | 96.8% |
| Interquartile 25% (IQ1) | 81.7% | 94.5% |
| Interquartile 75% (IQ3) | 94.2% | 100.0% |
| Interquartile Range (IQR) | 12.4% | 5.5% |
| Standard Deviation (Sample) | 14.2% | 3.3% |
| Standard Deviation (Population) | 14.1% | 3.2% |
Similar Demographics by 1 or more Vehicles in Household
Demographics Similar to Immigrants from Uzbekistan by 1 or more Vehicles in Household
In terms of 1 or more vehicles in household, the demographic groups most similar to Immigrants from Uzbekistan are Vietnamese (73.8%, a difference of 0.62%), Barbadian (74.0%, a difference of 0.82%), Immigrants from Bangladesh (74.3%, a difference of 1.3%), Inupiat (71.5%, a difference of 2.6%), and Guyanese (70.8%, a difference of 3.6%).
| Demographics | Rating | Rank | 1 or more Vehicles in Household |
| Immigrants | Trinidad and Tobago | 0.0 /100 | #330 | Tragic 76.8% |
| West Indians | 0.0 /100 | #331 | Tragic 76.4% |
| Trinidadians and Tobagonians | 0.0 /100 | #332 | Tragic 76.3% |
| Immigrants | Ecuador | 0.0 /100 | #333 | Tragic 76.2% |
| Immigrants | Bangladesh | 0.0 /100 | #334 | Tragic 74.3% |
| Barbadians | 0.0 /100 | #335 | Tragic 74.0% |
| Vietnamese | 0.0 /100 | #336 | Tragic 73.8% |
| Immigrants | Uzbekistan | 0.0 /100 | #337 | Tragic 73.4% |
| Inupiat | 0.0 /100 | #338 | Tragic 71.5% |
| Guyanese | 0.0 /100 | #339 | Tragic 70.8% |
| Dominicans | 0.0 /100 | #340 | Tragic 70.7% |
| Immigrants | Barbados | 0.0 /100 | #341 | Tragic 70.6% |
| Immigrants | Guyana | 0.0 /100 | #342 | Tragic 70.6% |
| British West Indians | 0.0 /100 | #343 | Tragic 70.4% |
| Immigrants | Dominican Republic | 0.0 /100 | #344 | Tragic 68.6% |
Demographics Similar to Basques by 1 or more Vehicles in Household
In terms of 1 or more vehicles in household, the demographic groups most similar to Basques are Cherokee (92.4%, a difference of 0.010%), Samoan (92.4%, a difference of 0.040%), Native Hawaiian (92.4%, a difference of 0.050%), Finnish (92.4%, a difference of 0.050%), and Sri Lankan (92.5%, a difference of 0.070%).
| Demographics | Rating | Rank | 1 or more Vehicles in Household |
| Immigrants | Iraq | 100.0 /100 | #25 | Exceptional 92.5% |
| British | 100.0 /100 | #26 | Exceptional 92.5% |
| Americans | 100.0 /100 | #27 | Exceptional 92.5% |
| Sri Lankans | 100.0 /100 | #28 | Exceptional 92.5% |
| Native Hawaiians | 100.0 /100 | #29 | Exceptional 92.4% |
| Finns | 100.0 /100 | #30 | Exceptional 92.4% |
| Samoans | 100.0 /100 | #31 | Exceptional 92.4% |
| Basques | 100.0 /100 | #32 | Exceptional 92.4% |
| Cherokee | 100.0 /100 | #33 | Exceptional 92.4% |
| Italians | 99.9 /100 | #34 | Exceptional 92.3% |
| Czechoslovakians | 99.9 /100 | #35 | Exceptional 92.3% |
| Malaysians | 99.9 /100 | #36 | Exceptional 92.3% |
| French Canadians | 99.9 /100 | #37 | Exceptional 92.3% |
| Immigrants | Vietnam | 99.9 /100 | #38 | Exceptional 92.3% |
| Swiss | 99.9 /100 | #39 | Exceptional 92.3% |