Slovene vs Scottish 2 or more Vehicles in Household
COMPARE
Slovene
Scottish
2 or more Vehicles in Household
2 or more Vehicles in Household Comparison
Slovenes
Scottish
58.3%
2 OR MORE VEHICLES IN HOUSEHOLD
99.5/ 100
METRIC RATING
77th/ 347
METRIC RANK
61.2%
2 OR MORE VEHICLES IN HOUSEHOLD
100.0/ 100
METRIC RATING
19th/ 347
METRIC RANK
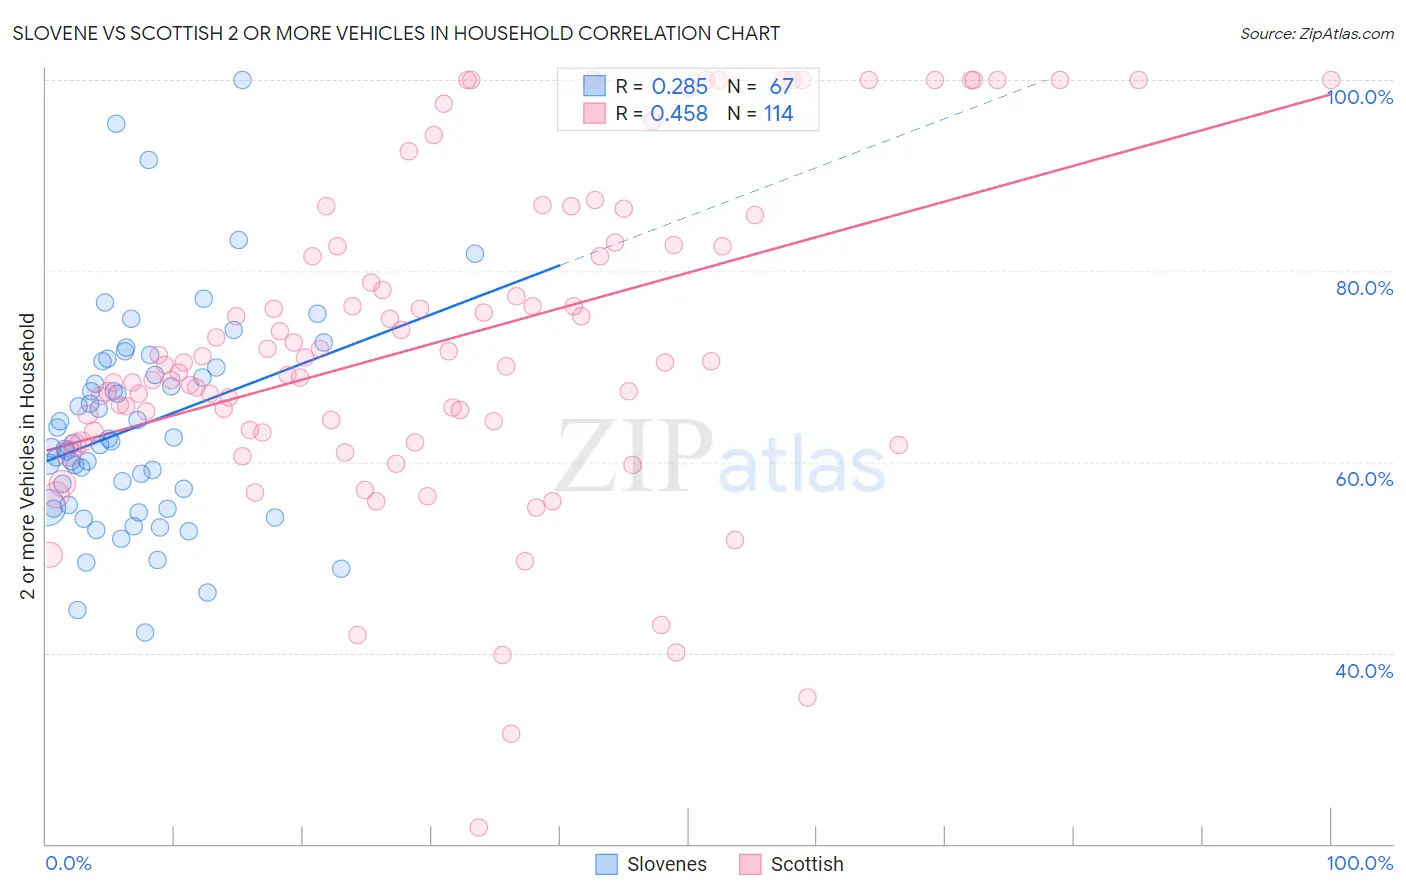
Slovene vs Scottish 2 or more Vehicles in Household Correlation Chart
The statistical analysis conducted on geographies consisting of 261,272,828 people shows a weak positive correlation between the proportion of Slovenes and percentage of households with 2 or more vehicles available in the United States with a correlation coefficient (R) of 0.285 and weighted average of 58.3%. Similarly, the statistical analysis conducted on geographies consisting of 566,626,490 people shows a moderate positive correlation between the proportion of Scottish and percentage of households with 2 or more vehicles available in the United States with a correlation coefficient (R) of 0.458 and weighted average of 61.2%, a difference of 5.1%.
2 or more Vehicles in Household Correlation Summary
| Measurement | Slovene | Scottish |
| Minimum | 42.1% | 21.7% |
| Maximum | 100.0% | 100.0% |
| Range | 57.9% | 78.3% |
| Mean | 63.7% | 72.7% |
| Median | 61.9% | 70.5% |
| Interquartile 25% (IQ1) | 55.3% | 63.2% |
| Interquartile 75% (IQ3) | 69.9% | 82.8% |
| Interquartile Range (IQR) | 14.6% | 19.6% |
| Standard Deviation (Sample) | 11.2% | 16.9% |
| Standard Deviation (Population) | 11.1% | 16.8% |
Similar Demographics by 2 or more Vehicles in Household
Demographics Similar to Slovenes by 2 or more Vehicles in Household
In terms of 2 or more vehicles in household, the demographic groups most similar to Slovenes are Creek (58.3%, a difference of 0.010%), Polish (58.3%, a difference of 0.040%), Lithuanian (58.2%, a difference of 0.050%), Bolivian (58.3%, a difference of 0.12%), and Immigrants from Afghanistan (58.3%, a difference of 0.12%).
| Demographics | Rating | Rank | 2 or more Vehicles in Household |
| Italians | 99.6 /100 | #70 | Exceptional 58.4% |
| Bangladeshis | 99.6 /100 | #71 | Exceptional 58.4% |
| Austrians | 99.6 /100 | #72 | Exceptional 58.4% |
| Bolivians | 99.6 /100 | #73 | Exceptional 58.3% |
| Immigrants | Afghanistan | 99.6 /100 | #74 | Exceptional 58.3% |
| Poles | 99.5 /100 | #75 | Exceptional 58.3% |
| Creek | 99.5 /100 | #76 | Exceptional 58.3% |
| Slovenes | 99.5 /100 | #77 | Exceptional 58.3% |
| Lithuanians | 99.5 /100 | #78 | Exceptional 58.2% |
| Delaware | 99.4 /100 | #79 | Exceptional 58.2% |
| Immigrants | England | 99.3 /100 | #80 | Exceptional 58.1% |
| Immigrants | Iraq | 99.3 /100 | #81 | Exceptional 58.1% |
| Iranians | 99.3 /100 | #82 | Exceptional 58.1% |
| Icelanders | 99.2 /100 | #83 | Exceptional 58.0% |
| Maltese | 99.2 /100 | #84 | Exceptional 58.0% |
Demographics Similar to Scottish by 2 or more Vehicles in Household
In terms of 2 or more vehicles in household, the demographic groups most similar to Scottish are European (61.4%, a difference of 0.20%), Basque (61.4%, a difference of 0.22%), Native Hawaiian (61.4%, a difference of 0.28%), Nepalese (61.4%, a difference of 0.31%), and Sri Lankan (61.0%, a difference of 0.35%).
| Demographics | Rating | Rank | 2 or more Vehicles in Household |
| Germans | 100.0 /100 | #12 | Exceptional 61.6% |
| Samoans | 100.0 /100 | #13 | Exceptional 61.5% |
| Czechs | 100.0 /100 | #14 | Exceptional 61.5% |
| Nepalese | 100.0 /100 | #15 | Exceptional 61.4% |
| Native Hawaiians | 100.0 /100 | #16 | Exceptional 61.4% |
| Basques | 100.0 /100 | #17 | Exceptional 61.4% |
| Europeans | 100.0 /100 | #18 | Exceptional 61.4% |
| Scottish | 100.0 /100 | #19 | Exceptional 61.2% |
| Sri Lankans | 100.0 /100 | #20 | Exceptional 61.0% |
| Koreans | 100.0 /100 | #21 | Exceptional 61.0% |
| Swiss | 100.0 /100 | #22 | Exceptional 61.0% |
| Scotch-Irish | 100.0 /100 | #23 | Exceptional 60.9% |
| Immigrants | Vietnam | 100.0 /100 | #24 | Exceptional 60.9% |
| Whites/Caucasians | 100.0 /100 | #25 | Exceptional 60.8% |
| Welsh | 100.0 /100 | #26 | Exceptional 60.8% |