Immigrants from Bosnia and Herzegovina vs Scottish 2 or more Vehicles in Household
COMPARE
Immigrants from Bosnia and Herzegovina
Scottish
2 or more Vehicles in Household
2 or more Vehicles in Household Comparison
Immigrants from Bosnia and Herzegovina
Scottish
53.8%
2 OR MORE VEHICLES IN HOUSEHOLD
5.5/ 100
METRIC RATING
223rd/ 347
METRIC RANK
61.2%
2 OR MORE VEHICLES IN HOUSEHOLD
100.0/ 100
METRIC RATING
19th/ 347
METRIC RANK
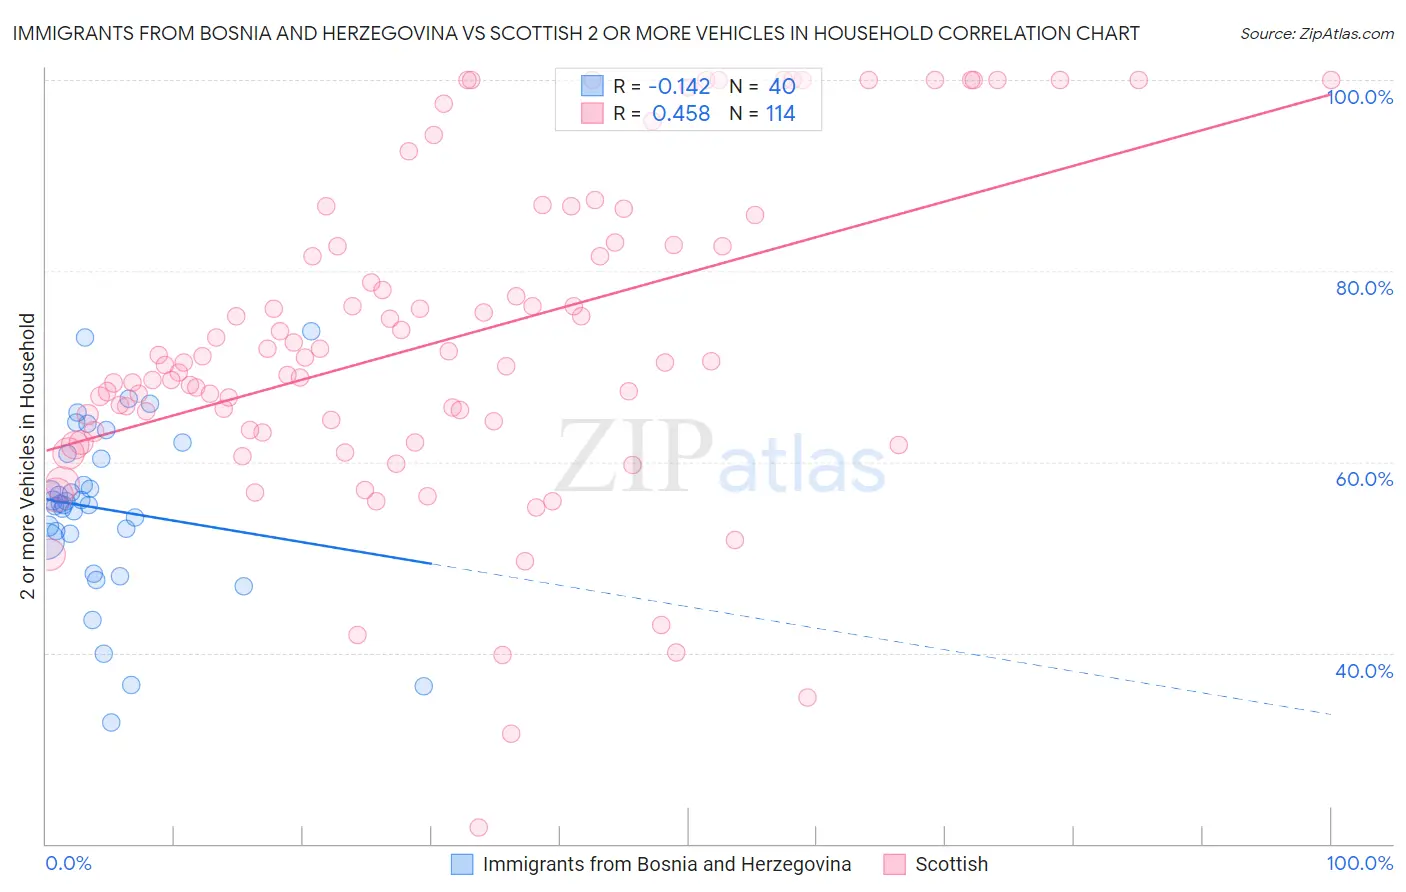
Immigrants from Bosnia and Herzegovina vs Scottish 2 or more Vehicles in Household Correlation Chart
The statistical analysis conducted on geographies consisting of 156,805,510 people shows a poor negative correlation between the proportion of Immigrants from Bosnia and Herzegovina and percentage of households with 2 or more vehicles available in the United States with a correlation coefficient (R) of -0.142 and weighted average of 53.8%. Similarly, the statistical analysis conducted on geographies consisting of 566,626,490 people shows a moderate positive correlation between the proportion of Scottish and percentage of households with 2 or more vehicles available in the United States with a correlation coefficient (R) of 0.458 and weighted average of 61.2%, a difference of 13.9%.
2 or more Vehicles in Household Correlation Summary
| Measurement | Immigrants from Bosnia and Herzegovina | Scottish |
| Minimum | 32.7% | 21.7% |
| Maximum | 73.7% | 100.0% |
| Range | 41.0% | 78.3% |
| Mean | 55.0% | 72.7% |
| Median | 55.6% | 70.5% |
| Interquartile 25% (IQ1) | 52.1% | 63.2% |
| Interquartile 75% (IQ3) | 60.6% | 82.8% |
| Interquartile Range (IQR) | 8.5% | 19.6% |
| Standard Deviation (Sample) | 9.0% | 16.9% |
| Standard Deviation (Population) | 8.9% | 16.8% |
Similar Demographics by 2 or more Vehicles in Household
Demographics Similar to Immigrants from Bosnia and Herzegovina by 2 or more Vehicles in Household
In terms of 2 or more vehicles in household, the demographic groups most similar to Immigrants from Bosnia and Herzegovina are Brazilian (53.8%, a difference of 0.040%), Immigrants from Egypt (53.8%, a difference of 0.050%), Immigrants from Eastern Africa (53.7%, a difference of 0.070%), Kiowa (53.9%, a difference of 0.13%), and Immigrants from Singapore (53.9%, a difference of 0.15%).
| Demographics | Rating | Rank | 2 or more Vehicles in Household |
| Immigrants | Western Asia | 9.3 /100 | #216 | Tragic 54.1% |
| Immigrants | Burma/Myanmar | 7.1 /100 | #217 | Tragic 53.9% |
| Immigrants | Argentina | 6.8 /100 | #218 | Tragic 53.9% |
| South American Indians | 6.5 /100 | #219 | Tragic 53.9% |
| Taiwanese | 6.3 /100 | #220 | Tragic 53.9% |
| Immigrants | Singapore | 6.3 /100 | #221 | Tragic 53.9% |
| Kiowa | 6.2 /100 | #222 | Tragic 53.9% |
| Immigrants | Bosnia and Herzegovina | 5.5 /100 | #223 | Tragic 53.8% |
| Brazilians | 5.3 /100 | #224 | Tragic 53.8% |
| Immigrants | Egypt | 5.2 /100 | #225 | Tragic 53.8% |
| Immigrants | Eastern Africa | 5.1 /100 | #226 | Tragic 53.7% |
| Sudanese | 4.1 /100 | #227 | Tragic 53.6% |
| Alaska Natives | 3.9 /100 | #228 | Tragic 53.6% |
| Immigrants | Turkey | 3.8 /100 | #229 | Tragic 53.6% |
| Immigrants | Nepal | 3.6 /100 | #230 | Tragic 53.5% |
Demographics Similar to Scottish by 2 or more Vehicles in Household
In terms of 2 or more vehicles in household, the demographic groups most similar to Scottish are European (61.4%, a difference of 0.20%), Basque (61.4%, a difference of 0.22%), Native Hawaiian (61.4%, a difference of 0.28%), Nepalese (61.4%, a difference of 0.31%), and Sri Lankan (61.0%, a difference of 0.35%).
| Demographics | Rating | Rank | 2 or more Vehicles in Household |
| Germans | 100.0 /100 | #12 | Exceptional 61.6% |
| Samoans | 100.0 /100 | #13 | Exceptional 61.5% |
| Czechs | 100.0 /100 | #14 | Exceptional 61.5% |
| Nepalese | 100.0 /100 | #15 | Exceptional 61.4% |
| Native Hawaiians | 100.0 /100 | #16 | Exceptional 61.4% |
| Basques | 100.0 /100 | #17 | Exceptional 61.4% |
| Europeans | 100.0 /100 | #18 | Exceptional 61.4% |
| Scottish | 100.0 /100 | #19 | Exceptional 61.2% |
| Sri Lankans | 100.0 /100 | #20 | Exceptional 61.0% |
| Koreans | 100.0 /100 | #21 | Exceptional 61.0% |
| Swiss | 100.0 /100 | #22 | Exceptional 61.0% |
| Scotch-Irish | 100.0 /100 | #23 | Exceptional 60.9% |
| Immigrants | Vietnam | 100.0 /100 | #24 | Exceptional 60.9% |
| Whites/Caucasians | 100.0 /100 | #25 | Exceptional 60.8% |
| Welsh | 100.0 /100 | #26 | Exceptional 60.8% |