Immigrants from Turkey vs Marshallese Householder Income Ages 25 - 44 years
COMPARE
Immigrants from Turkey
Marshallese
Householder Income Ages 25 - 44 years
Householder Income Ages 25 - 44 years Comparison
Immigrants from Turkey
Marshallese
$107,258
HOUSEHOLDER INCOME AGES 25 - 44 YEARS
99.9/ 100
METRIC RATING
49th/ 347
METRIC RANK
$83,575
HOUSEHOLDER INCOME AGES 25 - 44 YEARS
0.2/ 100
METRIC RATING
274th/ 347
METRIC RANK
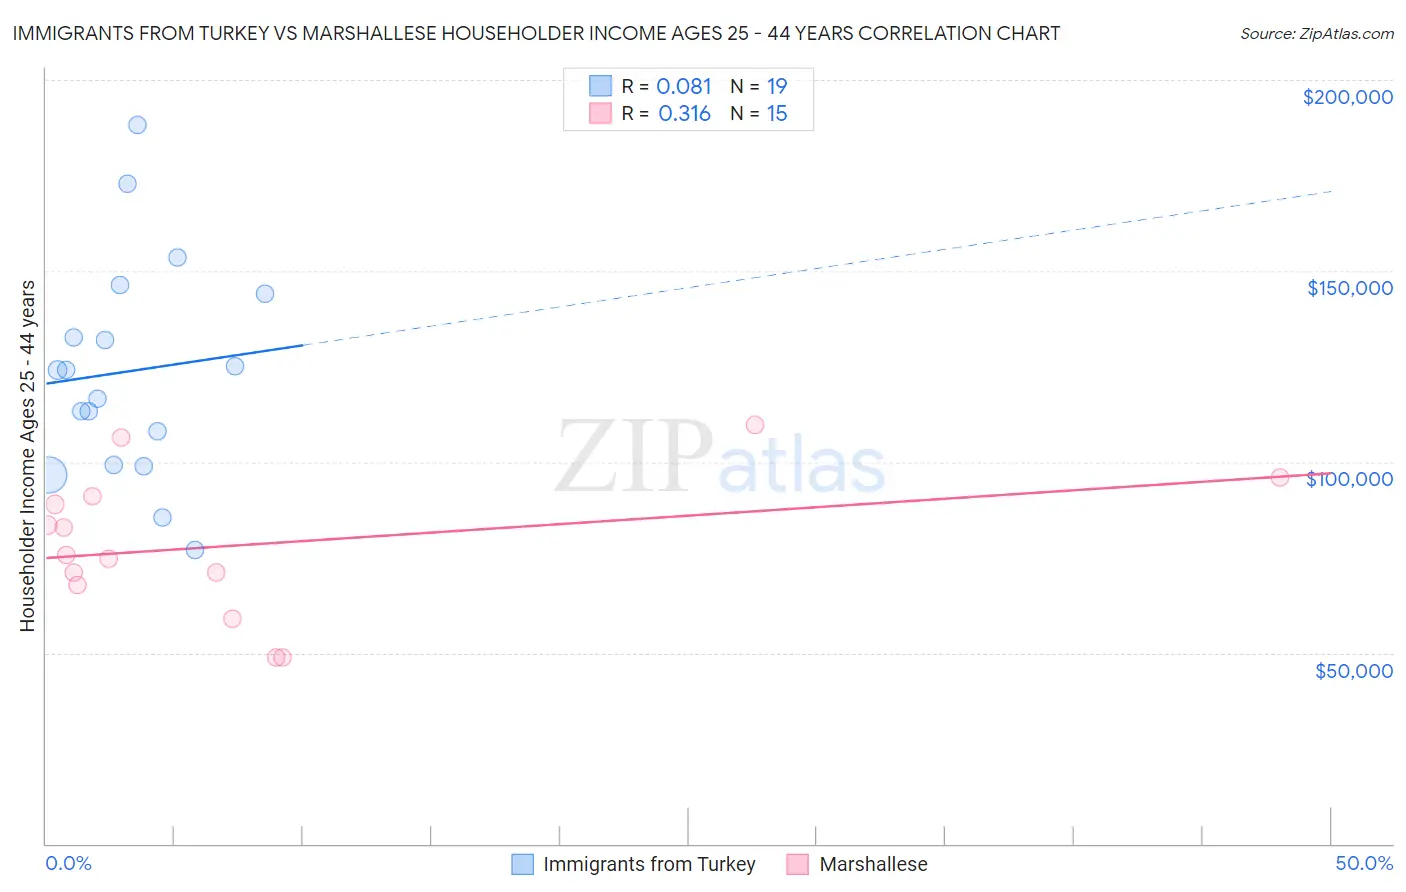
Immigrants from Turkey vs Marshallese Householder Income Ages 25 - 44 years Correlation Chart
The statistical analysis conducted on geographies consisting of 222,801,410 people shows a slight positive correlation between the proportion of Immigrants from Turkey and household income with householder between the ages 25 and 44 in the United States with a correlation coefficient (R) of 0.081 and weighted average of $107,258. Similarly, the statistical analysis conducted on geographies consisting of 14,753,881 people shows a mild positive correlation between the proportion of Marshallese and household income with householder between the ages 25 and 44 in the United States with a correlation coefficient (R) of 0.316 and weighted average of $83,575, a difference of 28.3%.
Householder Income Ages 25 - 44 years Correlation Summary
| Measurement | Immigrants from Turkey | Marshallese |
| Minimum | $76,806 | $48,906 |
| Maximum | $188,366 | $109,583 |
| Range | $111,560 | $60,677 |
| Mean | $123,727 | $78,342 |
| Median | $124,014 | $75,712 |
| Interquartile 25% (IQ1) | $99,024 | $67,813 |
| Interquartile 75% (IQ3) | $144,167 | $91,124 |
| Interquartile Range (IQR) | $45,143 | $23,311 |
| Standard Deviation (Sample) | $28,597 | $18,418 |
| Standard Deviation (Population) | $27,834 | $17,794 |
Similar Demographics by Householder Income Ages 25 - 44 years
Demographics Similar to Immigrants from Turkey by Householder Income Ages 25 - 44 years
In terms of householder income ages 25 - 44 years, the demographic groups most similar to Immigrants from Turkey are Estonian ($107,269, a difference of 0.010%), Bulgarian ($107,264, a difference of 0.010%), Cambodian ($107,148, a difference of 0.10%), Immigrants from Belarus ($107,393, a difference of 0.13%), and Israeli ($107,579, a difference of 0.30%).
| Demographics | Rating | Rank | Householder Income Ages 25 - 44 years |
| Australians | 99.9 /100 | #42 | Exceptional $107,912 |
| Immigrants | Malaysia | 99.9 /100 | #43 | Exceptional $107,650 |
| Immigrants | Indonesia | 99.9 /100 | #44 | Exceptional $107,627 |
| Israelis | 99.9 /100 | #45 | Exceptional $107,579 |
| Immigrants | Belarus | 99.9 /100 | #46 | Exceptional $107,393 |
| Estonians | 99.9 /100 | #47 | Exceptional $107,269 |
| Bulgarians | 99.9 /100 | #48 | Exceptional $107,264 |
| Immigrants | Turkey | 99.9 /100 | #49 | Exceptional $107,258 |
| Cambodians | 99.9 /100 | #50 | Exceptional $107,148 |
| Immigrants | Czechoslovakia | 99.9 /100 | #51 | Exceptional $106,888 |
| Immigrants | Europe | 99.9 /100 | #52 | Exceptional $106,817 |
| Immigrants | Norway | 99.9 /100 | #53 | Exceptional $106,629 |
| Paraguayans | 99.9 /100 | #54 | Exceptional $106,615 |
| Greeks | 99.9 /100 | #55 | Exceptional $106,457 |
| Immigrants | Pakistan | 99.8 /100 | #56 | Exceptional $106,129 |
Demographics Similar to Marshallese by Householder Income Ages 25 - 44 years
In terms of householder income ages 25 - 44 years, the demographic groups most similar to Marshallese are Iroquois ($83,682, a difference of 0.13%), Spanish American ($83,722, a difference of 0.18%), Somali ($83,752, a difference of 0.21%), Immigrants from Jamaica ($83,298, a difference of 0.33%), and Jamaican ($83,933, a difference of 0.43%).
| Demographics | Rating | Rank | Householder Income Ages 25 - 44 years |
| Hmong | 0.3 /100 | #267 | Tragic $84,258 |
| Sub-Saharan Africans | 0.3 /100 | #268 | Tragic $84,235 |
| Spanish American Indians | 0.3 /100 | #269 | Tragic $84,085 |
| Jamaicans | 0.3 /100 | #270 | Tragic $83,933 |
| Somalis | 0.2 /100 | #271 | Tragic $83,752 |
| Spanish Americans | 0.2 /100 | #272 | Tragic $83,722 |
| Iroquois | 0.2 /100 | #273 | Tragic $83,682 |
| Marshallese | 0.2 /100 | #274 | Tragic $83,575 |
| Immigrants | Jamaica | 0.2 /100 | #275 | Tragic $83,298 |
| Immigrants | Belize | 0.2 /100 | #276 | Tragic $83,141 |
| Paiute | 0.2 /100 | #277 | Tragic $82,984 |
| Senegalese | 0.2 /100 | #278 | Tragic $82,852 |
| Pima | 0.1 /100 | #279 | Tragic $82,821 |
| Colville | 0.1 /100 | #280 | Tragic $82,604 |
| Cajuns | 0.1 /100 | #281 | Tragic $82,393 |