Immigrants from Thailand vs Immigrants from Ecuador 2 or more Vehicles in Household
COMPARE
Immigrants from Thailand
Immigrants from Ecuador
2 or more Vehicles in Household
2 or more Vehicles in Household Comparison
Immigrants from Thailand
Immigrants from Ecuador
56.6%
2 OR MORE VEHICLES IN HOUSEHOLD
90.7/ 100
METRIC RATING
127th/ 347
METRIC RANK
40.5%
2 OR MORE VEHICLES IN HOUSEHOLD
0.0/ 100
METRIC RATING
333rd/ 347
METRIC RANK
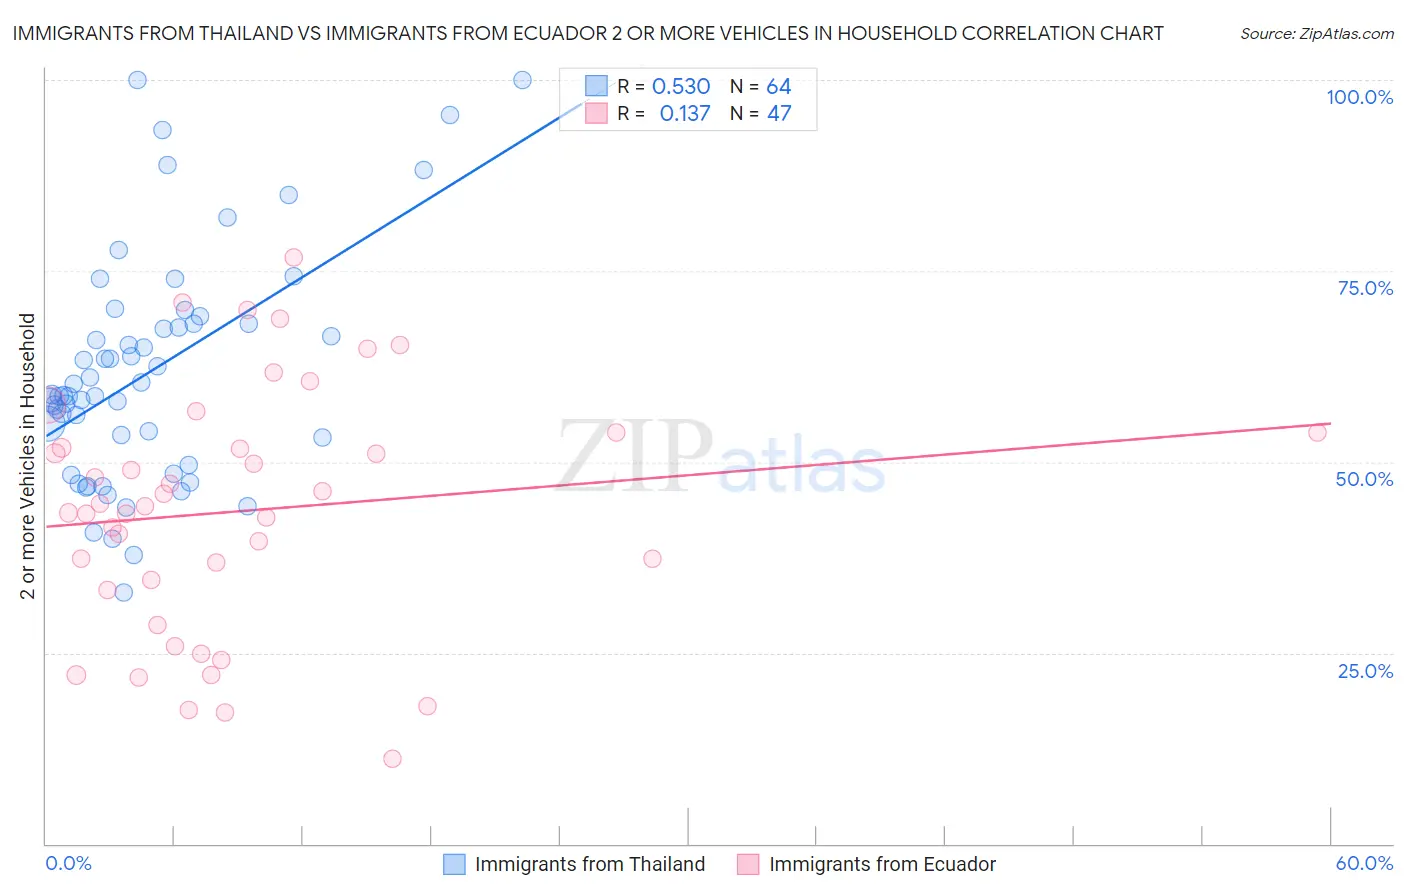
Immigrants from Thailand vs Immigrants from Ecuador 2 or more Vehicles in Household Correlation Chart
The statistical analysis conducted on geographies consisting of 316,937,920 people shows a substantial positive correlation between the proportion of Immigrants from Thailand and percentage of households with 2 or more vehicles available in the United States with a correlation coefficient (R) of 0.530 and weighted average of 56.6%. Similarly, the statistical analysis conducted on geographies consisting of 270,900,230 people shows a poor positive correlation between the proportion of Immigrants from Ecuador and percentage of households with 2 or more vehicles available in the United States with a correlation coefficient (R) of 0.137 and weighted average of 40.5%, a difference of 39.7%.
2 or more Vehicles in Household Correlation Summary
| Measurement | Immigrants from Thailand | Immigrants from Ecuador |
| Minimum | 32.8% | 11.1% |
| Maximum | 100.0% | 76.8% |
| Range | 67.2% | 65.7% |
| Mean | 61.8% | 43.6% |
| Median | 58.7% | 44.2% |
| Interquartile 25% (IQ1) | 51.4% | 33.2% |
| Interquartile 75% (IQ3) | 68.1% | 53.8% |
| Interquartile Range (IQR) | 16.7% | 20.6% |
| Standard Deviation (Sample) | 14.9% | 16.0% |
| Standard Deviation (Population) | 14.8% | 15.8% |
Similar Demographics by 2 or more Vehicles in Household
Demographics Similar to Immigrants from Thailand by 2 or more Vehicles in Household
In terms of 2 or more vehicles in household, the demographic groups most similar to Immigrants from Thailand are Immigrants from South Central Asia (56.6%, a difference of 0.020%), Estonian (56.6%, a difference of 0.030%), Ute (56.6%, a difference of 0.030%), Yugoslavian (56.6%, a difference of 0.070%), and Bulgarian (56.5%, a difference of 0.10%).
| Demographics | Rating | Rank | 2 or more Vehicles in Household |
| Costa Ricans | 94.7 /100 | #120 | Exceptional 56.9% |
| Sioux | 93.8 /100 | #121 | Exceptional 56.8% |
| Immigrants | South Africa | 92.5 /100 | #122 | Exceptional 56.7% |
| Australians | 91.8 /100 | #123 | Exceptional 56.7% |
| New Zealanders | 91.8 /100 | #124 | Exceptional 56.7% |
| Tsimshian | 91.6 /100 | #125 | Exceptional 56.7% |
| Estonians | 90.9 /100 | #126 | Exceptional 56.6% |
| Immigrants | Thailand | 90.7 /100 | #127 | Exceptional 56.6% |
| Immigrants | South Central Asia | 90.5 /100 | #128 | Exceptional 56.6% |
| Ute | 90.4 /100 | #129 | Exceptional 56.6% |
| Yugoslavians | 90.0 /100 | #130 | Exceptional 56.6% |
| Bulgarians | 89.7 /100 | #131 | Excellent 56.5% |
| Hungarians | 89.1 /100 | #132 | Excellent 56.5% |
| Comanche | 88.4 /100 | #133 | Excellent 56.5% |
| Immigrants | Azores | 86.6 /100 | #134 | Excellent 56.4% |
Demographics Similar to Immigrants from Ecuador by 2 or more Vehicles in Household
In terms of 2 or more vehicles in household, the demographic groups most similar to Immigrants from Ecuador are Immigrants from Trinidad and Tobago (40.3%, a difference of 0.58%), Trinidadian and Tobagonian (40.9%, a difference of 0.92%), West Indian (41.3%, a difference of 1.9%), Immigrants from Dominica (41.6%, a difference of 2.8%), and Ecuadorian (42.0%, a difference of 3.6%).
| Demographics | Rating | Rank | 2 or more Vehicles in Household |
| Immigrants | Senegal | 0.0 /100 | #326 | Tragic 43.0% |
| Immigrants | Yemen | 0.0 /100 | #327 | Tragic 42.8% |
| Inupiat | 0.0 /100 | #328 | Tragic 42.6% |
| Ecuadorians | 0.0 /100 | #329 | Tragic 42.0% |
| Immigrants | Dominica | 0.0 /100 | #330 | Tragic 41.6% |
| West Indians | 0.0 /100 | #331 | Tragic 41.3% |
| Trinidadians and Tobagonians | 0.0 /100 | #332 | Tragic 40.9% |
| Immigrants | Ecuador | 0.0 /100 | #333 | Tragic 40.5% |
| Immigrants | Trinidad and Tobago | 0.0 /100 | #334 | Tragic 40.3% |
| Immigrants | Bangladesh | 0.0 /100 | #335 | Tragic 38.8% |
| Vietnamese | 0.0 /100 | #336 | Tragic 38.5% |
| Barbadians | 0.0 /100 | #337 | Tragic 38.3% |
| Immigrants | Uzbekistan | 0.0 /100 | #338 | Tragic 37.9% |
| Immigrants | Barbados | 0.0 /100 | #339 | Tragic 35.8% |
| British West Indians | 0.0 /100 | #340 | Tragic 35.4% |