Belizean vs Immigrants from Ecuador 2 or more Vehicles in Household
COMPARE
Belizean
Immigrants from Ecuador
2 or more Vehicles in Household
2 or more Vehicles in Household Comparison
Belizeans
Immigrants from Ecuador
51.0%
2 OR MORE VEHICLES IN HOUSEHOLD
0.0/ 100
METRIC RATING
291st/ 347
METRIC RANK
40.5%
2 OR MORE VEHICLES IN HOUSEHOLD
0.0/ 100
METRIC RATING
333rd/ 347
METRIC RANK
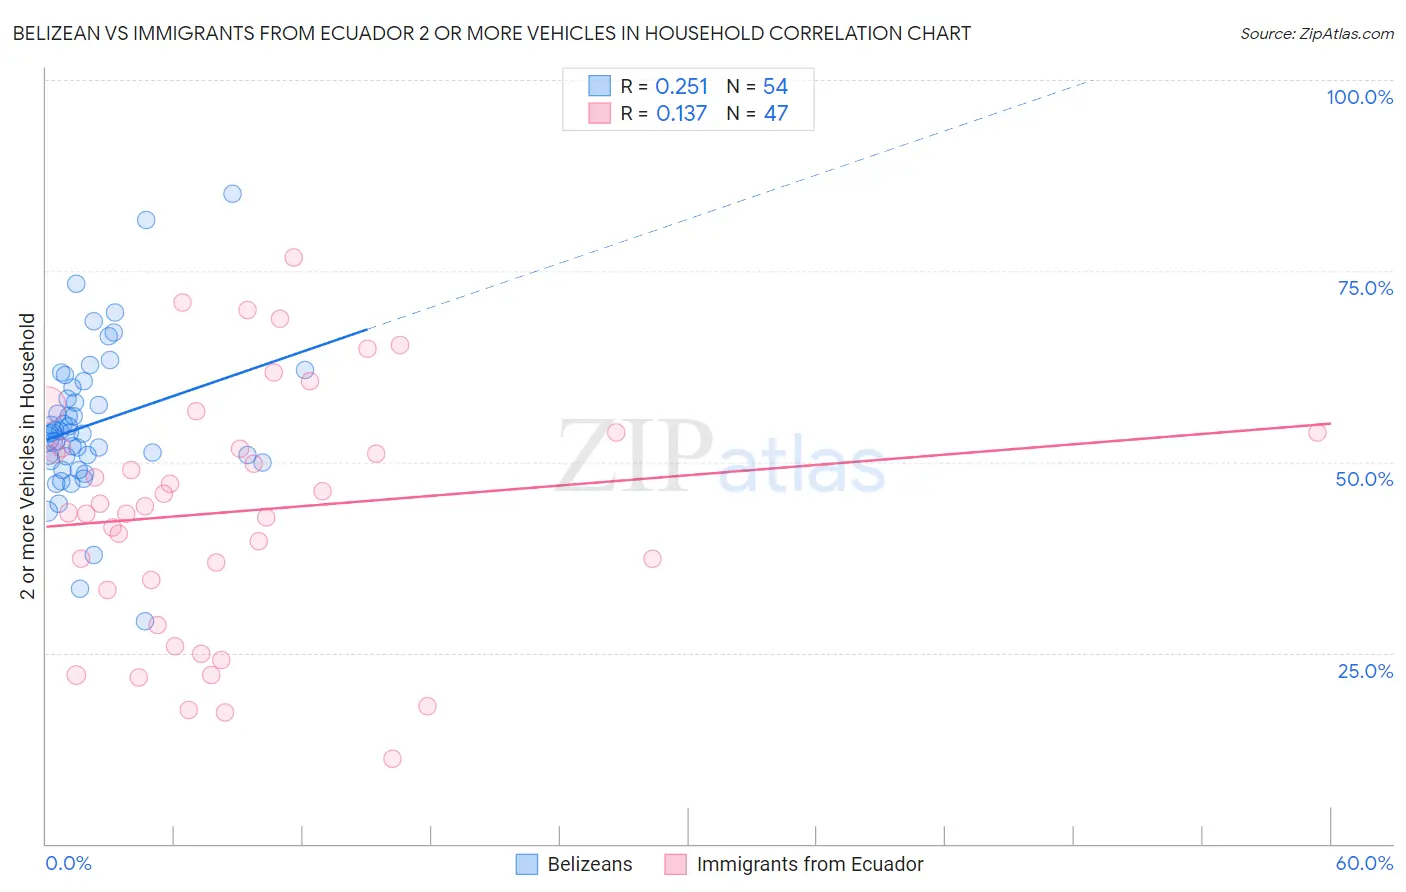
Belizean vs Immigrants from Ecuador 2 or more Vehicles in Household Correlation Chart
The statistical analysis conducted on geographies consisting of 144,162,212 people shows a weak positive correlation between the proportion of Belizeans and percentage of households with 2 or more vehicles available in the United States with a correlation coefficient (R) of 0.251 and weighted average of 51.0%. Similarly, the statistical analysis conducted on geographies consisting of 270,900,230 people shows a poor positive correlation between the proportion of Immigrants from Ecuador and percentage of households with 2 or more vehicles available in the United States with a correlation coefficient (R) of 0.137 and weighted average of 40.5%, a difference of 26.0%.
2 or more Vehicles in Household Correlation Summary
| Measurement | Belizean | Immigrants from Ecuador |
| Minimum | 29.2% | 11.1% |
| Maximum | 85.1% | 76.8% |
| Range | 55.9% | 65.7% |
| Mean | 54.9% | 43.6% |
| Median | 53.8% | 44.2% |
| Interquartile 25% (IQ1) | 50.2% | 33.2% |
| Interquartile 75% (IQ3) | 59.7% | 53.8% |
| Interquartile Range (IQR) | 9.5% | 20.6% |
| Standard Deviation (Sample) | 9.9% | 16.0% |
| Standard Deviation (Population) | 9.8% | 15.8% |
Similar Demographics by 2 or more Vehicles in Household
Demographics Similar to Belizeans by 2 or more Vehicles in Household
In terms of 2 or more vehicles in household, the demographic groups most similar to Belizeans are Immigrants from Panama (51.1%, a difference of 0.030%), Somali (51.1%, a difference of 0.10%), Immigrants from Ukraine (50.9%, a difference of 0.33%), Black/African American (50.9%, a difference of 0.33%), and Okinawan (51.2%, a difference of 0.38%).
| Demographics | Rating | Rank | 2 or more Vehicles in Household |
| Immigrants | Zaire | 0.1 /100 | #284 | Tragic 51.5% |
| Immigrants | Uruguay | 0.1 /100 | #285 | Tragic 51.4% |
| Immigrants | Liberia | 0.1 /100 | #286 | Tragic 51.3% |
| Immigrants | Serbia | 0.1 /100 | #287 | Tragic 51.3% |
| Okinawans | 0.1 /100 | #288 | Tragic 51.2% |
| Somalis | 0.0 /100 | #289 | Tragic 51.1% |
| Immigrants | Panama | 0.0 /100 | #290 | Tragic 51.1% |
| Belizeans | 0.0 /100 | #291 | Tragic 51.0% |
| Immigrants | Ukraine | 0.0 /100 | #292 | Tragic 50.9% |
| Blacks/African Americans | 0.0 /100 | #293 | Tragic 50.9% |
| Bermudans | 0.0 /100 | #294 | Tragic 50.6% |
| Cypriots | 0.0 /100 | #295 | Tragic 50.6% |
| Immigrants | Somalia | 0.0 /100 | #296 | Tragic 50.5% |
| Immigrants | Spain | 0.0 /100 | #297 | Tragic 50.4% |
| Paraguayans | 0.0 /100 | #298 | Tragic 50.3% |
Demographics Similar to Immigrants from Ecuador by 2 or more Vehicles in Household
In terms of 2 or more vehicles in household, the demographic groups most similar to Immigrants from Ecuador are Immigrants from Trinidad and Tobago (40.3%, a difference of 0.58%), Trinidadian and Tobagonian (40.9%, a difference of 0.92%), West Indian (41.3%, a difference of 1.9%), Immigrants from Dominica (41.6%, a difference of 2.8%), and Ecuadorian (42.0%, a difference of 3.6%).
| Demographics | Rating | Rank | 2 or more Vehicles in Household |
| Immigrants | Senegal | 0.0 /100 | #326 | Tragic 43.0% |
| Immigrants | Yemen | 0.0 /100 | #327 | Tragic 42.8% |
| Inupiat | 0.0 /100 | #328 | Tragic 42.6% |
| Ecuadorians | 0.0 /100 | #329 | Tragic 42.0% |
| Immigrants | Dominica | 0.0 /100 | #330 | Tragic 41.6% |
| West Indians | 0.0 /100 | #331 | Tragic 41.3% |
| Trinidadians and Tobagonians | 0.0 /100 | #332 | Tragic 40.9% |
| Immigrants | Ecuador | 0.0 /100 | #333 | Tragic 40.5% |
| Immigrants | Trinidad and Tobago | 0.0 /100 | #334 | Tragic 40.3% |
| Immigrants | Bangladesh | 0.0 /100 | #335 | Tragic 38.8% |
| Vietnamese | 0.0 /100 | #336 | Tragic 38.5% |
| Barbadians | 0.0 /100 | #337 | Tragic 38.3% |
| Immigrants | Uzbekistan | 0.0 /100 | #338 | Tragic 37.9% |
| Immigrants | Barbados | 0.0 /100 | #339 | Tragic 35.8% |
| British West Indians | 0.0 /100 | #340 | Tragic 35.4% |