Immigrants from Thailand vs Immigrants from Ecuador Cognitive Disability
COMPARE
Immigrants from Thailand
Immigrants from Ecuador
Cognitive Disability
Cognitive Disability Comparison
Immigrants from Thailand
Immigrants from Ecuador
17.9%
COGNITIVE DISABILITY
0.8/ 100
METRIC RATING
246th/ 347
METRIC RANK
17.2%
COGNITIVE DISABILITY
64.4/ 100
METRIC RATING
166th/ 347
METRIC RANK
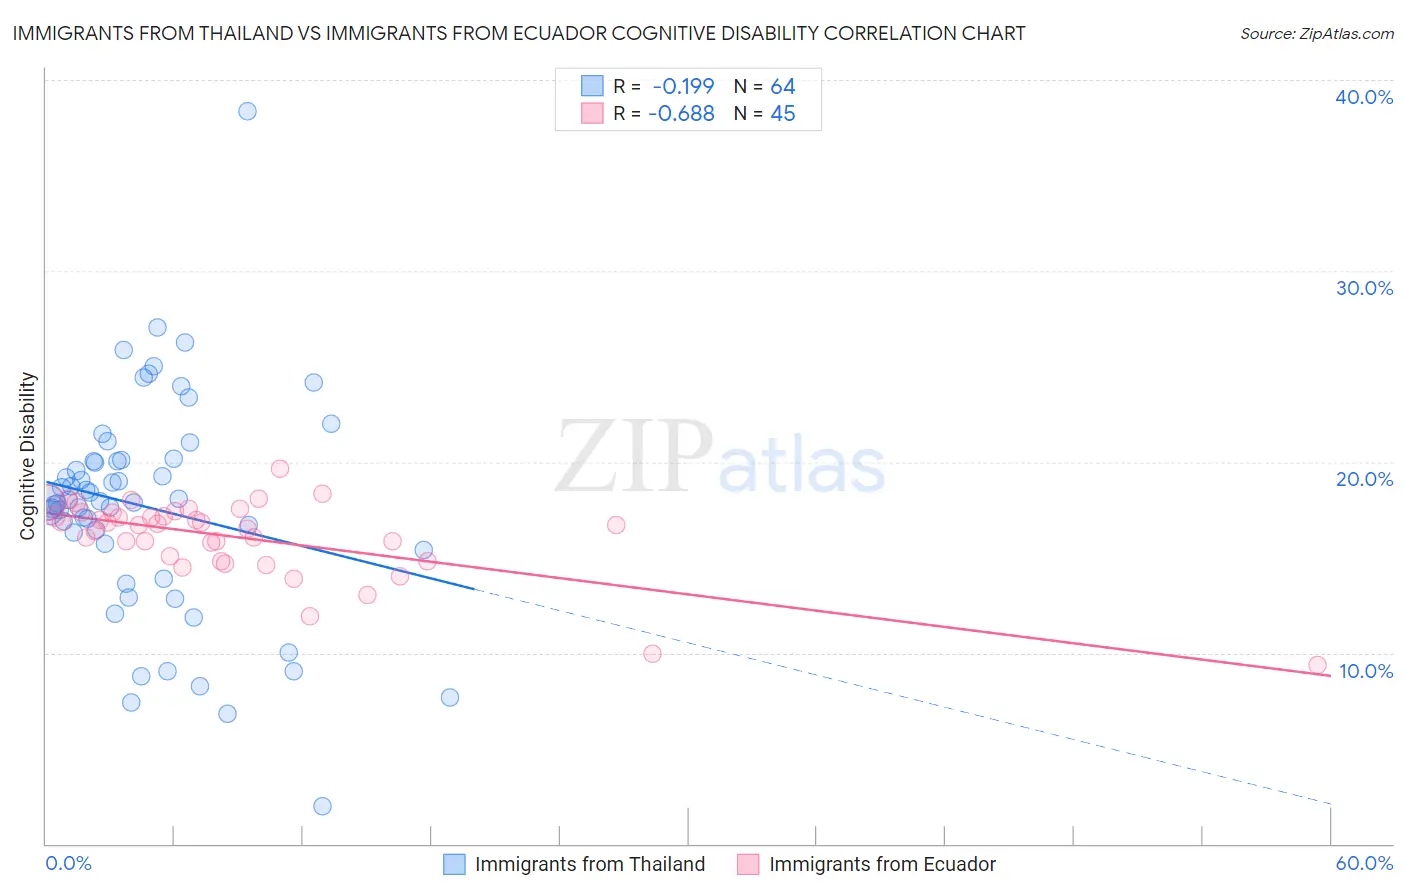
Immigrants from Thailand vs Immigrants from Ecuador Cognitive Disability Correlation Chart
The statistical analysis conducted on geographies consisting of 316,987,546 people shows a poor negative correlation between the proportion of Immigrants from Thailand and percentage of population with cognitive disability in the United States with a correlation coefficient (R) of -0.199 and weighted average of 17.9%. Similarly, the statistical analysis conducted on geographies consisting of 270,972,239 people shows a significant negative correlation between the proportion of Immigrants from Ecuador and percentage of population with cognitive disability in the United States with a correlation coefficient (R) of -0.688 and weighted average of 17.2%, a difference of 3.9%.
Cognitive Disability Correlation Summary
| Measurement | Immigrants from Thailand | Immigrants from Ecuador |
| Minimum | 2.0% | 9.4% |
| Maximum | 38.4% | 19.7% |
| Range | 36.4% | 10.3% |
| Mean | 17.6% | 16.1% |
| Median | 17.9% | 16.7% |
| Interquartile 25% (IQ1) | 15.5% | 14.9% |
| Interquartile 75% (IQ3) | 20.1% | 17.3% |
| Interquartile Range (IQR) | 4.5% | 2.4% |
| Standard Deviation (Sample) | 5.8% | 2.0% |
| Standard Deviation (Population) | 5.8% | 2.0% |
Similar Demographics by Cognitive Disability
Demographics Similar to Immigrants from Thailand by Cognitive Disability
In terms of cognitive disability, the demographic groups most similar to Immigrants from Thailand are Trinidadian and Tobagonian (17.9%, a difference of 0.020%), Samoan (17.9%, a difference of 0.070%), French American Indian (17.9%, a difference of 0.080%), Jamaican (17.9%, a difference of 0.12%), and Cree (17.9%, a difference of 0.13%).
| Demographics | Rating | Rank | Cognitive Disability |
| Cajuns | 1.4 /100 | #239 | Tragic 17.8% |
| Iraqis | 1.4 /100 | #240 | Tragic 17.8% |
| Mexicans | 1.1 /100 | #241 | Tragic 17.8% |
| Paiute | 1.1 /100 | #242 | Tragic 17.8% |
| Immigrants | Bangladesh | 1.0 /100 | #243 | Tragic 17.8% |
| Jamaicans | 0.9 /100 | #244 | Tragic 17.9% |
| Trinidadians and Tobagonians | 0.8 /100 | #245 | Tragic 17.9% |
| Immigrants | Thailand | 0.8 /100 | #246 | Tragic 17.9% |
| Samoans | 0.7 /100 | #247 | Tragic 17.9% |
| French American Indians | 0.7 /100 | #248 | Tragic 17.9% |
| Cree | 0.7 /100 | #249 | Tragic 17.9% |
| Immigrants | Ethiopia | 0.7 /100 | #250 | Tragic 17.9% |
| Malaysians | 0.6 /100 | #251 | Tragic 17.9% |
| Immigrants | Grenada | 0.6 /100 | #252 | Tragic 17.9% |
| Hopi | 0.6 /100 | #253 | Tragic 17.9% |
Demographics Similar to Immigrants from Ecuador by Cognitive Disability
In terms of cognitive disability, the demographic groups most similar to Immigrants from Ecuador are Immigrants from Albania (17.2%, a difference of 0.010%), Immigrants from Syria (17.2%, a difference of 0.030%), Immigrants (17.2%, a difference of 0.060%), Immigrants from Portugal (17.2%, a difference of 0.080%), and Ecuadorian (17.2%, a difference of 0.15%).
| Demographics | Rating | Rank | Cognitive Disability |
| Immigrants | Latvia | 73.2 /100 | #159 | Good 17.2% |
| Australians | 72.4 /100 | #160 | Good 17.2% |
| Americans | 72.2 /100 | #161 | Good 17.2% |
| Yugoslavians | 71.6 /100 | #162 | Good 17.2% |
| Immigrants | Switzerland | 71.5 /100 | #163 | Good 17.2% |
| Armenians | 70.1 /100 | #164 | Good 17.2% |
| Immigrants | Albania | 64.9 /100 | #165 | Good 17.2% |
| Immigrants | Ecuador | 64.4 /100 | #166 | Good 17.2% |
| Immigrants | Syria | 63.5 /100 | #167 | Good 17.2% |
| Immigrants | Immigrants | 62.5 /100 | #168 | Good 17.2% |
| Immigrants | Portugal | 61.8 /100 | #169 | Good 17.2% |
| Ecuadorians | 59.6 /100 | #170 | Average 17.2% |
| Tlingit-Haida | 59.4 /100 | #171 | Average 17.2% |
| Immigrants | Turkey | 56.7 /100 | #172 | Average 17.2% |
| Immigrants | Northern Africa | 50.2 /100 | #173 | Average 17.3% |