Immigrants from Sri Lanka vs Immigrants from Thailand 4 or more Vehicles in Household
COMPARE
Immigrants from Sri Lanka
Immigrants from Thailand
4 or more Vehicles in Household
4 or more Vehicles in Household Comparison
Immigrants from Sri Lanka
Immigrants from Thailand
6.1%
4 OR MORE VEHICLES IN HOUSEHOLD
23.7/ 100
METRIC RATING
197th/ 347
METRIC RANK
6.9%
4 OR MORE VEHICLES IN HOUSEHOLD
97.0/ 100
METRIC RATING
110th/ 347
METRIC RANK
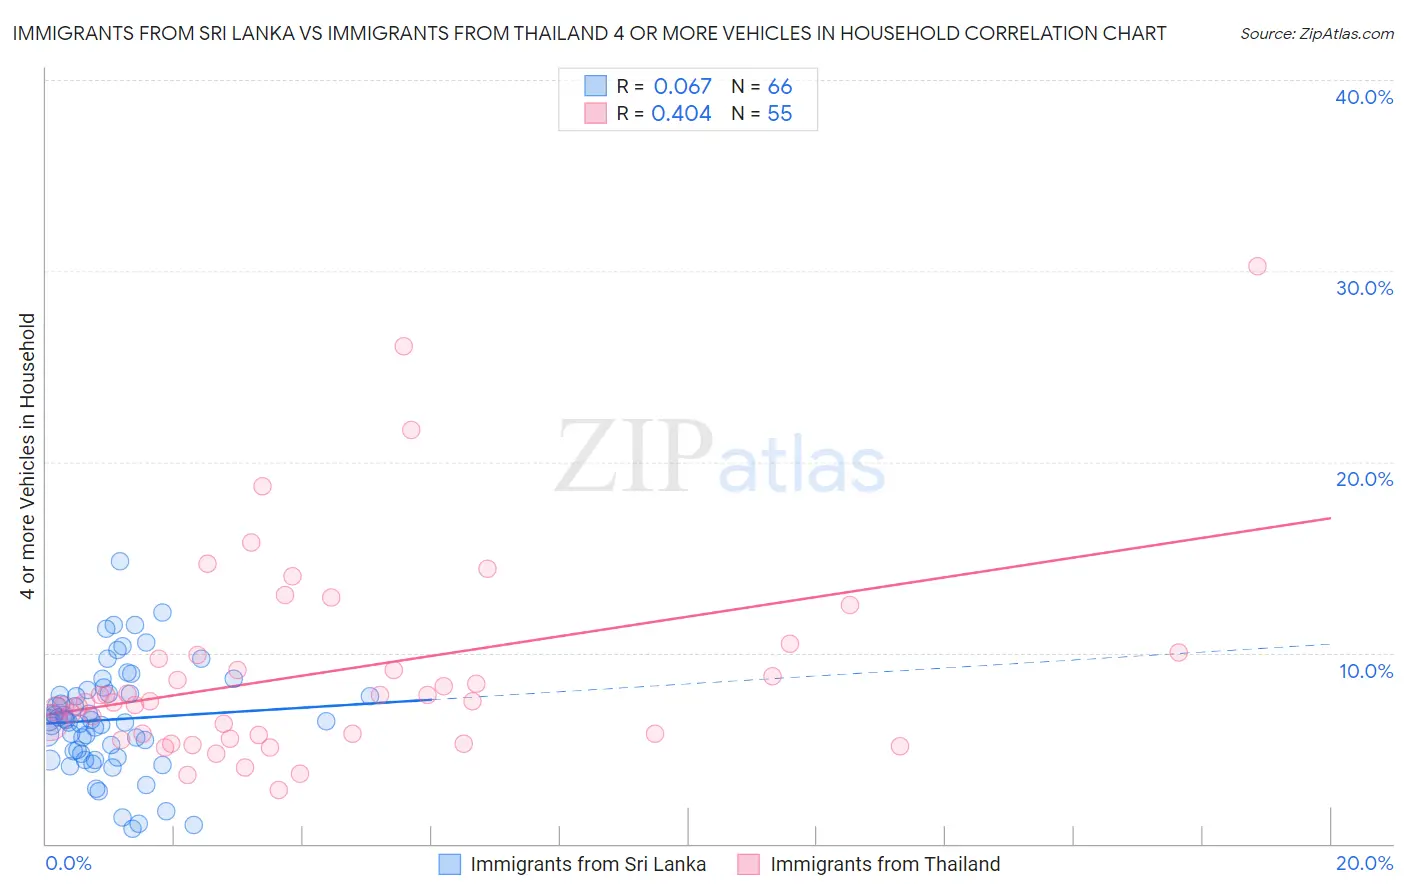
Immigrants from Sri Lanka vs Immigrants from Thailand 4 or more Vehicles in Household Correlation Chart
The statistical analysis conducted on geographies consisting of 149,309,194 people shows a slight positive correlation between the proportion of Immigrants from Sri Lanka and percentage of households with 4 or more vehicles available in the United States with a correlation coefficient (R) of 0.067 and weighted average of 6.1%. Similarly, the statistical analysis conducted on geographies consisting of 315,917,878 people shows a moderate positive correlation between the proportion of Immigrants from Thailand and percentage of households with 4 or more vehicles available in the United States with a correlation coefficient (R) of 0.404 and weighted average of 6.9%, a difference of 12.1%.
4 or more Vehicles in Household Correlation Summary
| Measurement | Immigrants from Sri Lanka | Immigrants from Thailand |
| Minimum | 0.78% | 2.8% |
| Maximum | 14.8% | 30.2% |
| Range | 14.0% | 27.4% |
| Mean | 6.5% | 9.0% |
| Median | 6.4% | 7.5% |
| Interquartile 25% (IQ1) | 4.7% | 5.7% |
| Interquartile 75% (IQ3) | 7.9% | 9.9% |
| Interquartile Range (IQR) | 3.1% | 4.2% |
| Standard Deviation (Sample) | 2.8% | 5.3% |
| Standard Deviation (Population) | 2.8% | 5.3% |
Similar Demographics by 4 or more Vehicles in Household
Demographics Similar to Immigrants from Sri Lanka by 4 or more Vehicles in Household
In terms of 4 or more vehicles in household, the demographic groups most similar to Immigrants from Sri Lanka are Immigrants from Portugal (6.1%, a difference of 0.20%), Immigrants from Norway (6.1%, a difference of 0.29%), Latvian (6.1%, a difference of 0.29%), Egyptian (6.1%, a difference of 0.35%), and Immigrants from South Central Asia (6.1%, a difference of 0.36%).
| Demographics | Rating | Rank | 4 or more Vehicles in Household |
| South Africans | 32.2 /100 | #190 | Fair 6.2% |
| Inupiat | 30.7 /100 | #191 | Fair 6.2% |
| Romanians | 30.7 /100 | #192 | Fair 6.2% |
| Immigrants | Kuwait | 28.0 /100 | #193 | Fair 6.2% |
| Immigrants | Sweden | 27.0 /100 | #194 | Fair 6.2% |
| Argentineans | 27.0 /100 | #195 | Fair 6.2% |
| Tsimshian | 26.4 /100 | #196 | Fair 6.2% |
| Immigrants | Sri Lanka | 23.7 /100 | #197 | Fair 6.1% |
| Immigrants | Portugal | 22.3 /100 | #198 | Fair 6.1% |
| Immigrants | Norway | 21.8 /100 | #199 | Fair 6.1% |
| Latvians | 21.7 /100 | #200 | Fair 6.1% |
| Egyptians | 21.4 /100 | #201 | Fair 6.1% |
| Immigrants | South Central Asia | 21.3 /100 | #202 | Fair 6.1% |
| Immigrants | Sierra Leone | 20.5 /100 | #203 | Fair 6.1% |
| Immigrants | Belize | 19.8 /100 | #204 | Poor 6.1% |
Demographics Similar to Immigrants from Thailand by 4 or more Vehicles in Household
In terms of 4 or more vehicles in household, the demographic groups most similar to Immigrants from Thailand are Aleut (6.9%, a difference of 0.020%), Hopi (6.9%, a difference of 0.030%), Canadian (6.9%, a difference of 0.45%), Filipino (6.9%, a difference of 0.50%), and Bolivian (6.8%, a difference of 0.50%).
| Demographics | Rating | Rank | 4 or more Vehicles in Household |
| Blackfeet | 98.6 /100 | #103 | Exceptional 7.0% |
| Hmong | 98.3 /100 | #104 | Exceptional 7.0% |
| German Russians | 98.3 /100 | #105 | Exceptional 7.0% |
| Guatemalans | 98.1 /100 | #106 | Exceptional 7.0% |
| Nicaraguans | 98.0 /100 | #107 | Exceptional 7.0% |
| French | 97.7 /100 | #108 | Exceptional 6.9% |
| Filipinos | 97.6 /100 | #109 | Exceptional 6.9% |
| Immigrants | Thailand | 97.0 /100 | #110 | Exceptional 6.9% |
| Aleuts | 97.0 /100 | #111 | Exceptional 6.9% |
| Hopi | 97.0 /100 | #112 | Exceptional 6.9% |
| Canadians | 96.4 /100 | #113 | Exceptional 6.9% |
| Bolivians | 96.3 /100 | #114 | Exceptional 6.8% |
| Tlingit-Haida | 96.2 /100 | #115 | Exceptional 6.8% |
| Immigrants | Guatemala | 95.8 /100 | #116 | Exceptional 6.8% |
| Burmese | 95.7 /100 | #117 | Exceptional 6.8% |