Immigrants from Sri Lanka vs Immigrants from Thailand Householder Income Ages 25 - 44 years
COMPARE
Immigrants from Sri Lanka
Immigrants from Thailand
Householder Income Ages 25 - 44 years
Householder Income Ages 25 - 44 years Comparison
Immigrants from Sri Lanka
Immigrants from Thailand
$109,741
HOUSEHOLDER INCOME AGES 25 - 44 YEARS
100.0/ 100
METRIC RATING
32nd/ 347
METRIC RANK
$91,337
HOUSEHOLDER INCOME AGES 25 - 44 YEARS
14.3/ 100
METRIC RATING
208th/ 347
METRIC RANK
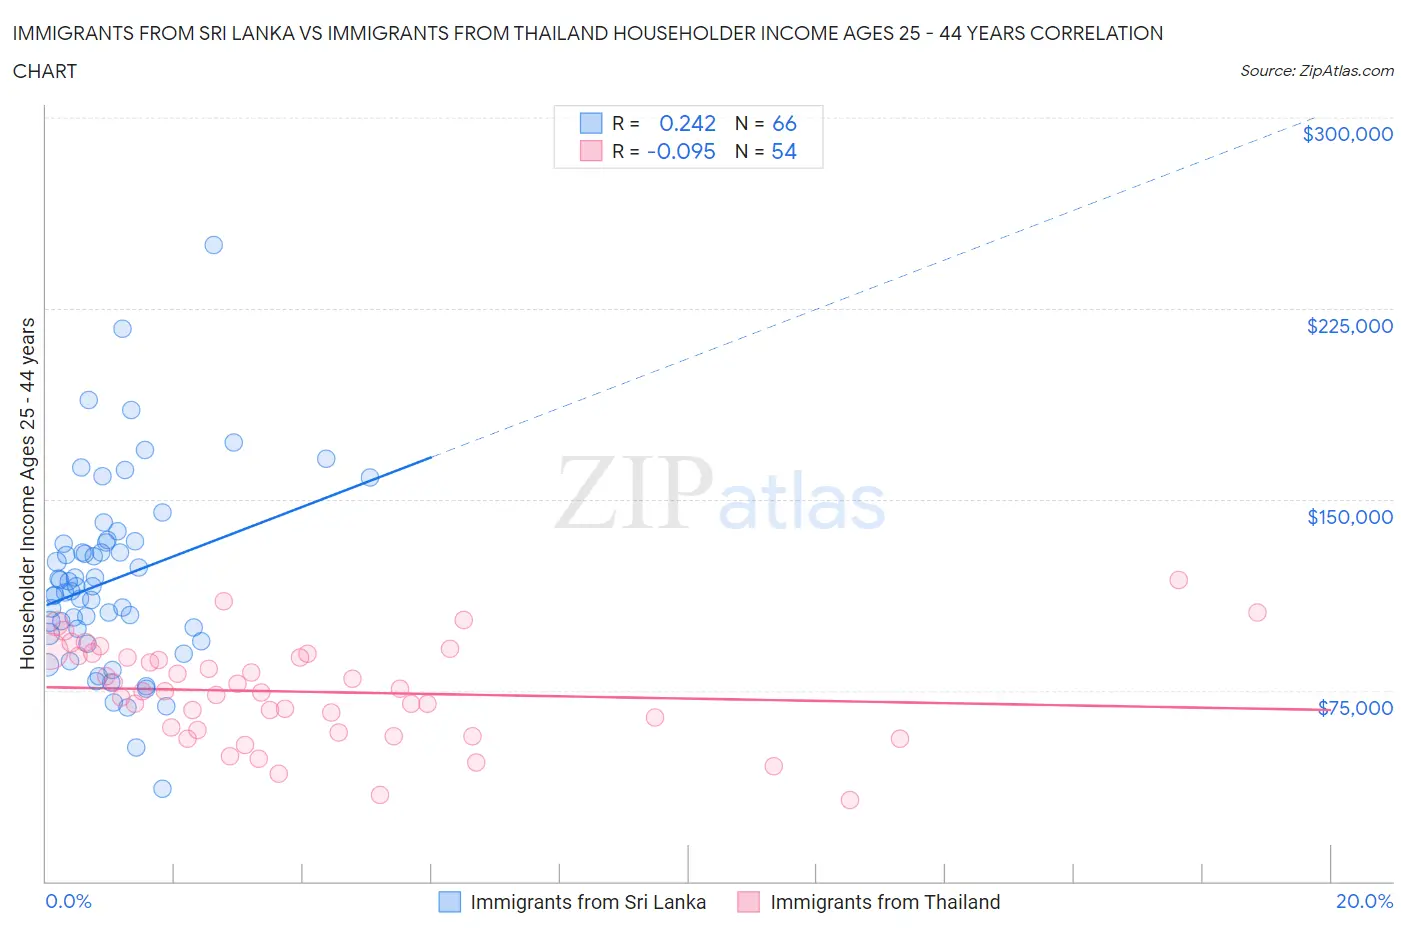
Immigrants from Sri Lanka vs Immigrants from Thailand Householder Income Ages 25 - 44 years Correlation Chart
The statistical analysis conducted on geographies consisting of 149,615,906 people shows a weak positive correlation between the proportion of Immigrants from Sri Lanka and household income with householder between the ages 25 and 44 in the United States with a correlation coefficient (R) of 0.242 and weighted average of $109,741. Similarly, the statistical analysis conducted on geographies consisting of 316,454,000 people shows a slight negative correlation between the proportion of Immigrants from Thailand and household income with householder between the ages 25 and 44 in the United States with a correlation coefficient (R) of -0.095 and weighted average of $91,337, a difference of 20.2%.
Householder Income Ages 25 - 44 years Correlation Summary
| Measurement | Immigrants from Sri Lanka | Immigrants from Thailand |
| Minimum | $36,230 | $32,083 |
| Maximum | $250,001 | $118,125 |
| Range | $213,771 | $86,042 |
| Mean | $118,421 | $74,382 |
| Median | $114,758 | $74,631 |
| Interquartile 25% (IQ1) | $97,290 | $59,491 |
| Interquartile 75% (IQ3) | $133,038 | $88,604 |
| Interquartile Range (IQR) | $35,748 | $29,112 |
| Standard Deviation (Sample) | $37,121 | $19,277 |
| Standard Deviation (Population) | $36,839 | $19,098 |
Similar Demographics by Householder Income Ages 25 - 44 years
Demographics Similar to Immigrants from Sri Lanka by Householder Income Ages 25 - 44 years
In terms of householder income ages 25 - 44 years, the demographic groups most similar to Immigrants from Sri Lanka are Bhutanese ($109,520, a difference of 0.20%), Maltese ($110,064, a difference of 0.29%), Immigrants from Greece ($110,103, a difference of 0.33%), Bolivian ($109,372, a difference of 0.34%), and Immigrants from Switzerland ($109,185, a difference of 0.51%).
| Demographics | Rating | Rank | Householder Income Ages 25 - 44 years |
| Immigrants | Northern Europe | 100.0 /100 | #25 | Exceptional $111,676 |
| Immigrants | Asia | 100.0 /100 | #26 | Exceptional $110,787 |
| Russians | 100.0 /100 | #27 | Exceptional $110,398 |
| Immigrants | Denmark | 100.0 /100 | #28 | Exceptional $110,363 |
| Turks | 100.0 /100 | #29 | Exceptional $110,318 |
| Immigrants | Greece | 100.0 /100 | #30 | Exceptional $110,103 |
| Maltese | 100.0 /100 | #31 | Exceptional $110,064 |
| Immigrants | Sri Lanka | 100.0 /100 | #32 | Exceptional $109,741 |
| Bhutanese | 100.0 /100 | #33 | Exceptional $109,520 |
| Bolivians | 100.0 /100 | #34 | Exceptional $109,372 |
| Immigrants | Switzerland | 100.0 /100 | #35 | Exceptional $109,185 |
| Latvians | 100.0 /100 | #36 | Exceptional $108,926 |
| Immigrants | Russia | 100.0 /100 | #37 | Exceptional $108,751 |
| Soviet Union | 100.0 /100 | #38 | Exceptional $108,457 |
| Immigrants | France | 99.9 /100 | #39 | Exceptional $108,257 |
Demographics Similar to Immigrants from Thailand by Householder Income Ages 25 - 44 years
In terms of householder income ages 25 - 44 years, the demographic groups most similar to Immigrants from Thailand are Yugoslavian ($91,368, a difference of 0.030%), Aleut ($91,370, a difference of 0.040%), Immigrants from Eastern Africa ($91,458, a difference of 0.13%), Nepalese ($91,498, a difference of 0.18%), and Immigrants from Uruguay ($91,171, a difference of 0.18%).
| Demographics | Rating | Rank | Householder Income Ages 25 - 44 years |
| Japanese | 16.4 /100 | #201 | Poor $91,624 |
| Ecuadorians | 16.0 /100 | #202 | Poor $91,574 |
| Immigrants | Cambodia | 15.7 /100 | #203 | Poor $91,533 |
| Nepalese | 15.4 /100 | #204 | Poor $91,498 |
| Immigrants | Eastern Africa | 15.2 /100 | #205 | Poor $91,458 |
| Aleuts | 14.5 /100 | #206 | Poor $91,370 |
| Yugoslavians | 14.5 /100 | #207 | Poor $91,368 |
| Immigrants | Thailand | 14.3 /100 | #208 | Poor $91,337 |
| Immigrants | Uruguay | 13.2 /100 | #209 | Poor $91,171 |
| Immigrants | Kenya | 10.9 /100 | #210 | Poor $90,767 |
| Iraqis | 10.8 /100 | #211 | Poor $90,764 |
| Hawaiians | 10.6 /100 | #212 | Poor $90,722 |
| Immigrants | Bangladesh | 9.3 /100 | #213 | Tragic $90,448 |
| Immigrants | Africa | 8.9 /100 | #214 | Tragic $90,372 |
| Panamanians | 8.1 /100 | #215 | Tragic $90,193 |