Immigrants from Sudan vs Immigrants from Thailand 4 or more Vehicles in Household
COMPARE
Immigrants from Sudan
Immigrants from Thailand
4 or more Vehicles in Household
4 or more Vehicles in Household Comparison
Immigrants from Sudan
Immigrants from Thailand
5.5%
4 OR MORE VEHICLES IN HOUSEHOLD
0.6/ 100
METRIC RATING
271st/ 347
METRIC RANK
6.9%
4 OR MORE VEHICLES IN HOUSEHOLD
97.0/ 100
METRIC RATING
110th/ 347
METRIC RANK
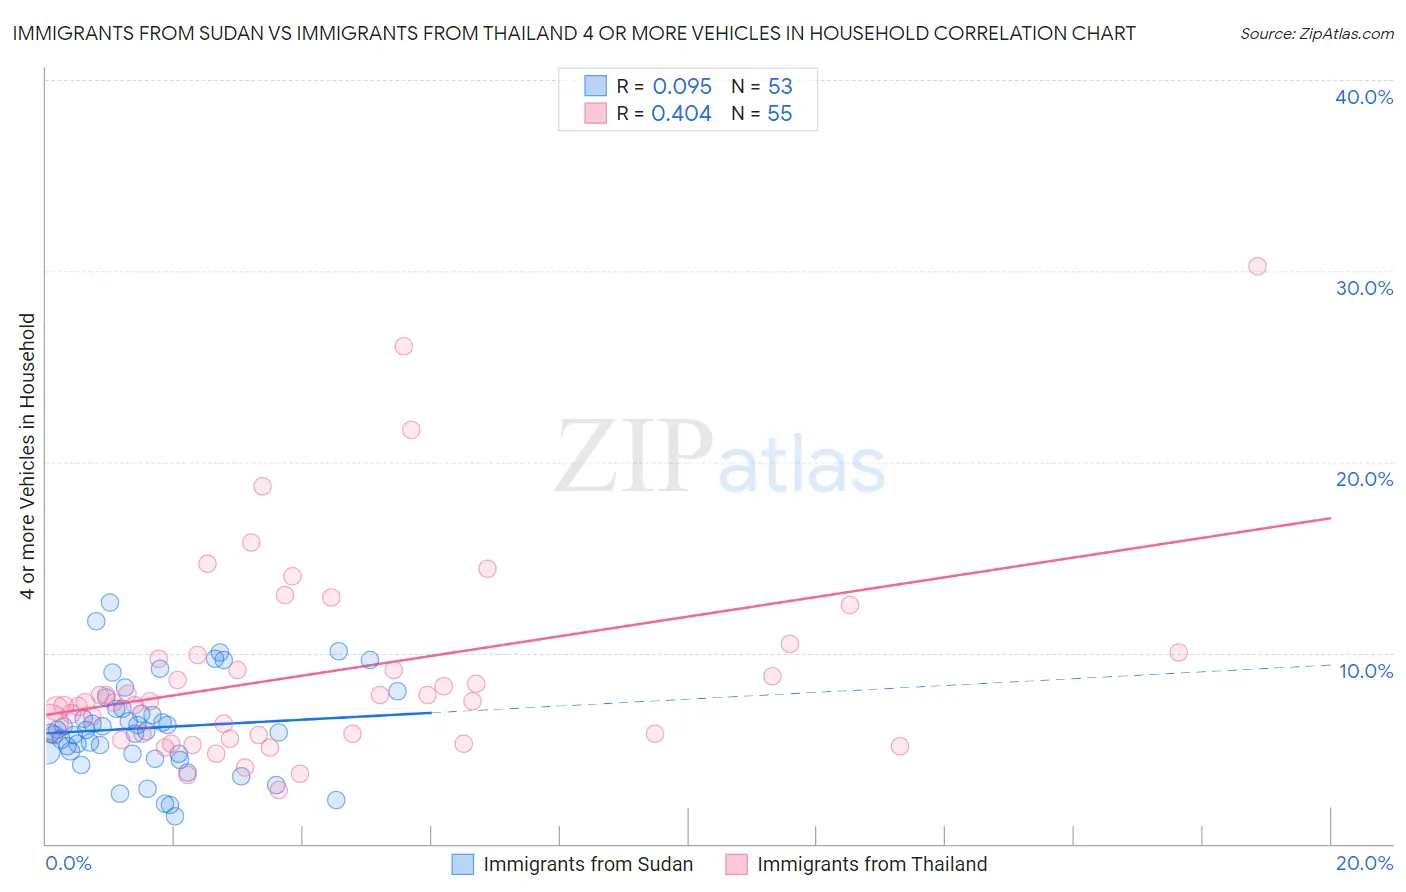
Immigrants from Sudan vs Immigrants from Thailand 4 or more Vehicles in Household Correlation Chart
The statistical analysis conducted on geographies consisting of 118,789,653 people shows a slight positive correlation between the proportion of Immigrants from Sudan and percentage of households with 4 or more vehicles available in the United States with a correlation coefficient (R) of 0.095 and weighted average of 5.5%. Similarly, the statistical analysis conducted on geographies consisting of 315,917,878 people shows a moderate positive correlation between the proportion of Immigrants from Thailand and percentage of households with 4 or more vehicles available in the United States with a correlation coefficient (R) of 0.404 and weighted average of 6.9%, a difference of 24.8%.
4 or more Vehicles in Household Correlation Summary
| Measurement | Immigrants from Sudan | Immigrants from Thailand |
| Minimum | 1.4% | 2.8% |
| Maximum | 12.6% | 30.2% |
| Range | 11.2% | 27.4% |
| Mean | 6.1% | 9.0% |
| Median | 5.9% | 7.5% |
| Interquartile 25% (IQ1) | 4.7% | 5.7% |
| Interquartile 75% (IQ3) | 7.1% | 9.9% |
| Interquartile Range (IQR) | 2.4% | 4.2% |
| Standard Deviation (Sample) | 2.4% | 5.3% |
| Standard Deviation (Population) | 2.4% | 5.3% |
Similar Demographics by 4 or more Vehicles in Household
Demographics Similar to Immigrants from Sudan by 4 or more Vehicles in Household
In terms of 4 or more vehicles in household, the demographic groups most similar to Immigrants from Sudan are Okinawan (5.5%, a difference of 0.10%), Immigrants from Kazakhstan (5.5%, a difference of 0.19%), Macedonian (5.5%, a difference of 0.23%), Carpatho Rusyn (5.5%, a difference of 0.30%), and Black/African American (5.5%, a difference of 0.35%).
| Demographics | Rating | Rank | 4 or more Vehicles in Household |
| Immigrants | Africa | 1.0 /100 | #264 | Tragic 5.6% |
| South Americans | 0.9 /100 | #265 | Tragic 5.6% |
| Immigrants | Nepal | 0.9 /100 | #266 | Tragic 5.6% |
| Immigrants | Ukraine | 0.9 /100 | #267 | Tragic 5.6% |
| Colombians | 0.7 /100 | #268 | Tragic 5.5% |
| Carpatho Rusyns | 0.7 /100 | #269 | Tragic 5.5% |
| Okinawans | 0.6 /100 | #270 | Tragic 5.5% |
| Immigrants | Sudan | 0.6 /100 | #271 | Tragic 5.5% |
| Immigrants | Kazakhstan | 0.6 /100 | #272 | Tragic 5.5% |
| Macedonians | 0.6 /100 | #273 | Tragic 5.5% |
| Blacks/African Americans | 0.6 /100 | #274 | Tragic 5.5% |
| Cambodians | 0.5 /100 | #275 | Tragic 5.5% |
| Immigrants | Latvia | 0.5 /100 | #276 | Tragic 5.5% |
| Immigrants | Bulgaria | 0.5 /100 | #277 | Tragic 5.5% |
| Immigrants | Eastern Europe | 0.4 /100 | #278 | Tragic 5.4% |
Demographics Similar to Immigrants from Thailand by 4 or more Vehicles in Household
In terms of 4 or more vehicles in household, the demographic groups most similar to Immigrants from Thailand are Aleut (6.9%, a difference of 0.020%), Hopi (6.9%, a difference of 0.030%), Canadian (6.9%, a difference of 0.45%), Filipino (6.9%, a difference of 0.50%), and Bolivian (6.8%, a difference of 0.50%).
| Demographics | Rating | Rank | 4 or more Vehicles in Household |
| Blackfeet | 98.6 /100 | #103 | Exceptional 7.0% |
| Hmong | 98.3 /100 | #104 | Exceptional 7.0% |
| German Russians | 98.3 /100 | #105 | Exceptional 7.0% |
| Guatemalans | 98.1 /100 | #106 | Exceptional 7.0% |
| Nicaraguans | 98.0 /100 | #107 | Exceptional 7.0% |
| French | 97.7 /100 | #108 | Exceptional 6.9% |
| Filipinos | 97.6 /100 | #109 | Exceptional 6.9% |
| Immigrants | Thailand | 97.0 /100 | #110 | Exceptional 6.9% |
| Aleuts | 97.0 /100 | #111 | Exceptional 6.9% |
| Hopi | 97.0 /100 | #112 | Exceptional 6.9% |
| Canadians | 96.4 /100 | #113 | Exceptional 6.9% |
| Bolivians | 96.3 /100 | #114 | Exceptional 6.8% |
| Tlingit-Haida | 96.2 /100 | #115 | Exceptional 6.8% |
| Immigrants | Guatemala | 95.8 /100 | #116 | Exceptional 6.8% |
| Burmese | 95.7 /100 | #117 | Exceptional 6.8% |