Immigrants from Sri Lanka vs Immigrants from Thailand Female Poverty Among 25-34 Year Olds
COMPARE
Immigrants from Sri Lanka
Immigrants from Thailand
Female Poverty Among 25-34 Year Olds
Female Poverty Among 25-34 Year Olds Comparison
Immigrants from Sri Lanka
Immigrants from Thailand
11.8%
FEMALE POVERTY AMONG 25-34 YEAR OLDS
99.8/ 100
METRIC RATING
36th/ 347
METRIC RANK
14.3%
FEMALE POVERTY AMONG 25-34 YEAR OLDS
5.2/ 100
METRIC RATING
218th/ 347
METRIC RANK
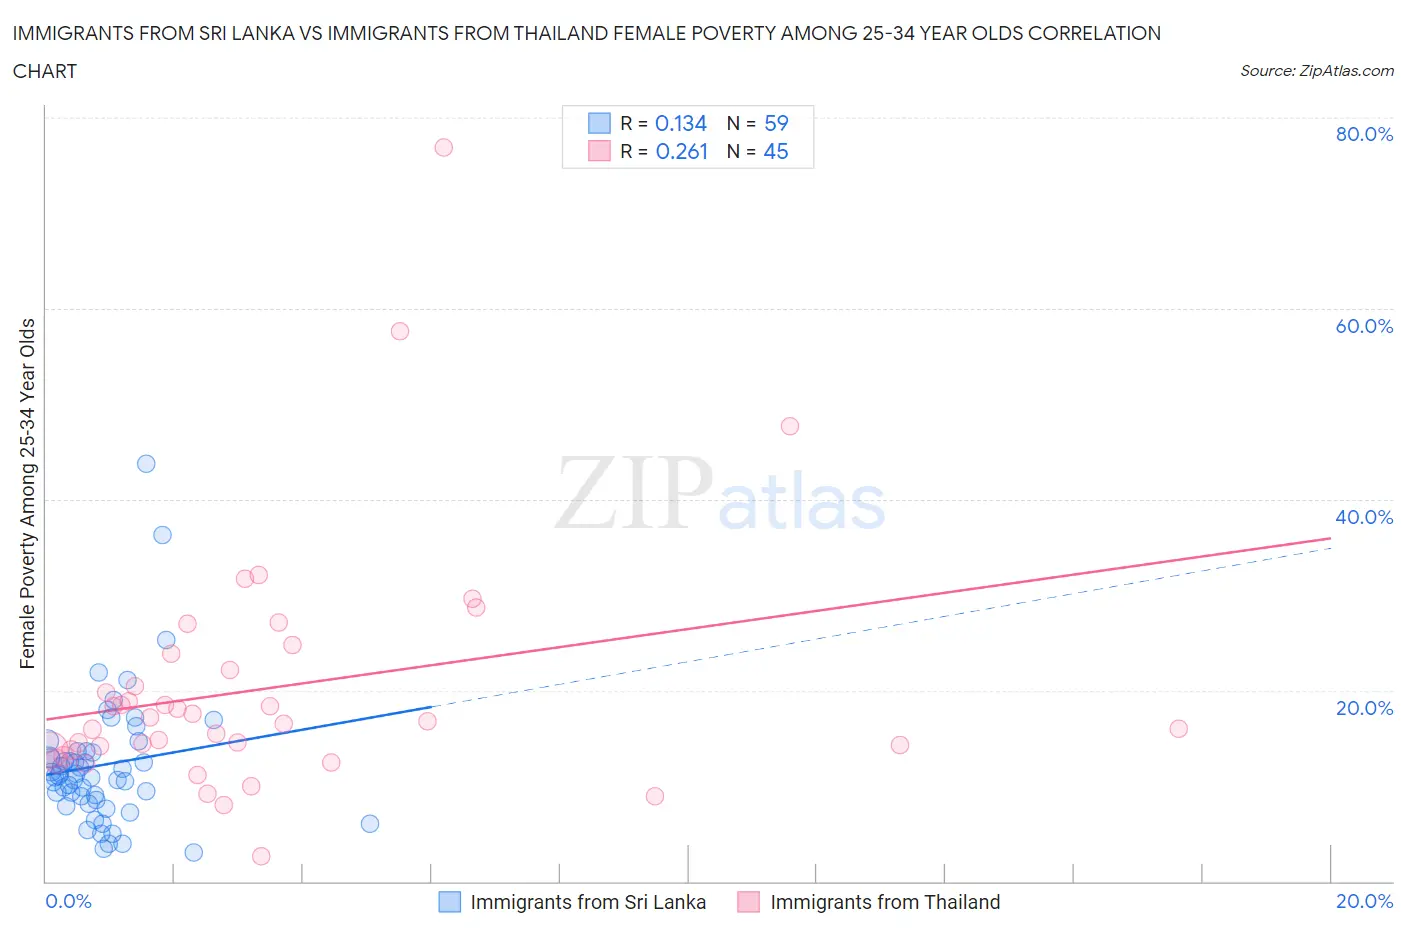
Immigrants from Sri Lanka vs Immigrants from Thailand Female Poverty Among 25-34 Year Olds Correlation Chart
The statistical analysis conducted on geographies consisting of 148,719,192 people shows a poor positive correlation between the proportion of Immigrants from Sri Lanka and poverty level among females between the ages 25 and 34 in the United States with a correlation coefficient (R) of 0.134 and weighted average of 11.8%. Similarly, the statistical analysis conducted on geographies consisting of 313,866,299 people shows a weak positive correlation between the proportion of Immigrants from Thailand and poverty level among females between the ages 25 and 34 in the United States with a correlation coefficient (R) of 0.261 and weighted average of 14.3%, a difference of 22.1%.
Female Poverty Among 25-34 Year Olds Correlation Summary
| Measurement | Immigrants from Sri Lanka | Immigrants from Thailand |
| Minimum | 3.1% | 2.6% |
| Maximum | 43.8% | 76.9% |
| Range | 40.7% | 74.3% |
| Mean | 12.2% | 20.2% |
| Median | 11.1% | 16.7% |
| Interquartile 25% (IQ1) | 8.5% | 13.8% |
| Interquartile 75% (IQ3) | 13.6% | 23.0% |
| Interquartile Range (IQR) | 5.2% | 9.2% |
| Standard Deviation (Sample) | 7.0% | 13.0% |
| Standard Deviation (Population) | 6.9% | 12.9% |
Similar Demographics by Female Poverty Among 25-34 Year Olds
Demographics Similar to Immigrants from Sri Lanka by Female Poverty Among 25-34 Year Olds
In terms of female poverty among 25-34 year olds, the demographic groups most similar to Immigrants from Sri Lanka are Taiwanese (11.8%, a difference of 0.16%), Immigrants from North Macedonia (11.8%, a difference of 0.23%), Latvian (11.8%, a difference of 0.48%), Cambodian (11.7%, a difference of 0.49%), and Immigrants from Bulgaria (11.8%, a difference of 0.64%).
| Demographics | Rating | Rank | Female Poverty Among 25-34 Year Olds |
| Bulgarians | 99.9 /100 | #29 | Exceptional 11.5% |
| Cypriots | 99.9 /100 | #30 | Exceptional 11.5% |
| Immigrants | Japan | 99.9 /100 | #31 | Exceptional 11.6% |
| Immigrants | Asia | 99.9 /100 | #32 | Exceptional 11.6% |
| Immigrants | Poland | 99.9 /100 | #33 | Exceptional 11.6% |
| Zimbabweans | 99.9 /100 | #34 | Exceptional 11.7% |
| Cambodians | 99.9 /100 | #35 | Exceptional 11.7% |
| Immigrants | Sri Lanka | 99.8 /100 | #36 | Exceptional 11.8% |
| Taiwanese | 99.8 /100 | #37 | Exceptional 11.8% |
| Immigrants | North Macedonia | 99.8 /100 | #38 | Exceptional 11.8% |
| Latvians | 99.8 /100 | #39 | Exceptional 11.8% |
| Immigrants | Bulgaria | 99.8 /100 | #40 | Exceptional 11.8% |
| Immigrants | Indonesia | 99.8 /100 | #41 | Exceptional 11.8% |
| Immigrants | Turkey | 99.7 /100 | #42 | Exceptional 11.9% |
| Egyptians | 99.7 /100 | #43 | Exceptional 11.9% |
Demographics Similar to Immigrants from Thailand by Female Poverty Among 25-34 Year Olds
In terms of female poverty among 25-34 year olds, the demographic groups most similar to Immigrants from Thailand are Ecuadorian (14.3%, a difference of 0.0%), French Canadian (14.3%, a difference of 0.11%), Spanish American Indian (14.3%, a difference of 0.11%), Ghanaian (14.4%, a difference of 0.17%), and Sudanese (14.4%, a difference of 0.32%).
| Demographics | Rating | Rank | Female Poverty Among 25-34 Year Olds |
| Trinidadians and Tobagonians | 8.2 /100 | #211 | Tragic 14.2% |
| Immigrants | Guyana | 6.6 /100 | #212 | Tragic 14.3% |
| Puget Sound Salish | 6.5 /100 | #213 | Tragic 14.3% |
| French | 6.2 /100 | #214 | Tragic 14.3% |
| Immigrants | Nigeria | 6.2 /100 | #215 | Tragic 14.3% |
| French Canadians | 5.5 /100 | #216 | Tragic 14.3% |
| Spanish American Indians | 5.5 /100 | #217 | Tragic 14.3% |
| Immigrants | Thailand | 5.2 /100 | #218 | Tragic 14.3% |
| Ecuadorians | 5.2 /100 | #219 | Tragic 14.3% |
| Ghanaians | 4.8 /100 | #220 | Tragic 14.4% |
| Sudanese | 4.4 /100 | #221 | Tragic 14.4% |
| Immigrants | Portugal | 4.3 /100 | #222 | Tragic 14.4% |
| Nigerians | 4.2 /100 | #223 | Tragic 14.4% |
| Immigrants | Sudan | 4.0 /100 | #224 | Tragic 14.4% |
| Immigrants | Barbados | 3.4 /100 | #225 | Tragic 14.5% |