Immigrants from Sri Lanka vs Immigrants from West Indies No Vehicles in Household
COMPARE
Immigrants from Sri Lanka
Immigrants from West Indies
No Vehicles in Household
No Vehicles in Household Comparison
Immigrants from Sri Lanka
Immigrants from West Indies
11.2%
NO VEHICLES IN HOUSEHOLD
10.6/ 100
METRIC RATING
215th/ 347
METRIC RANK
20.5%
NO VEHICLES IN HOUSEHOLD
0.0/ 100
METRIC RATING
326th/ 347
METRIC RANK
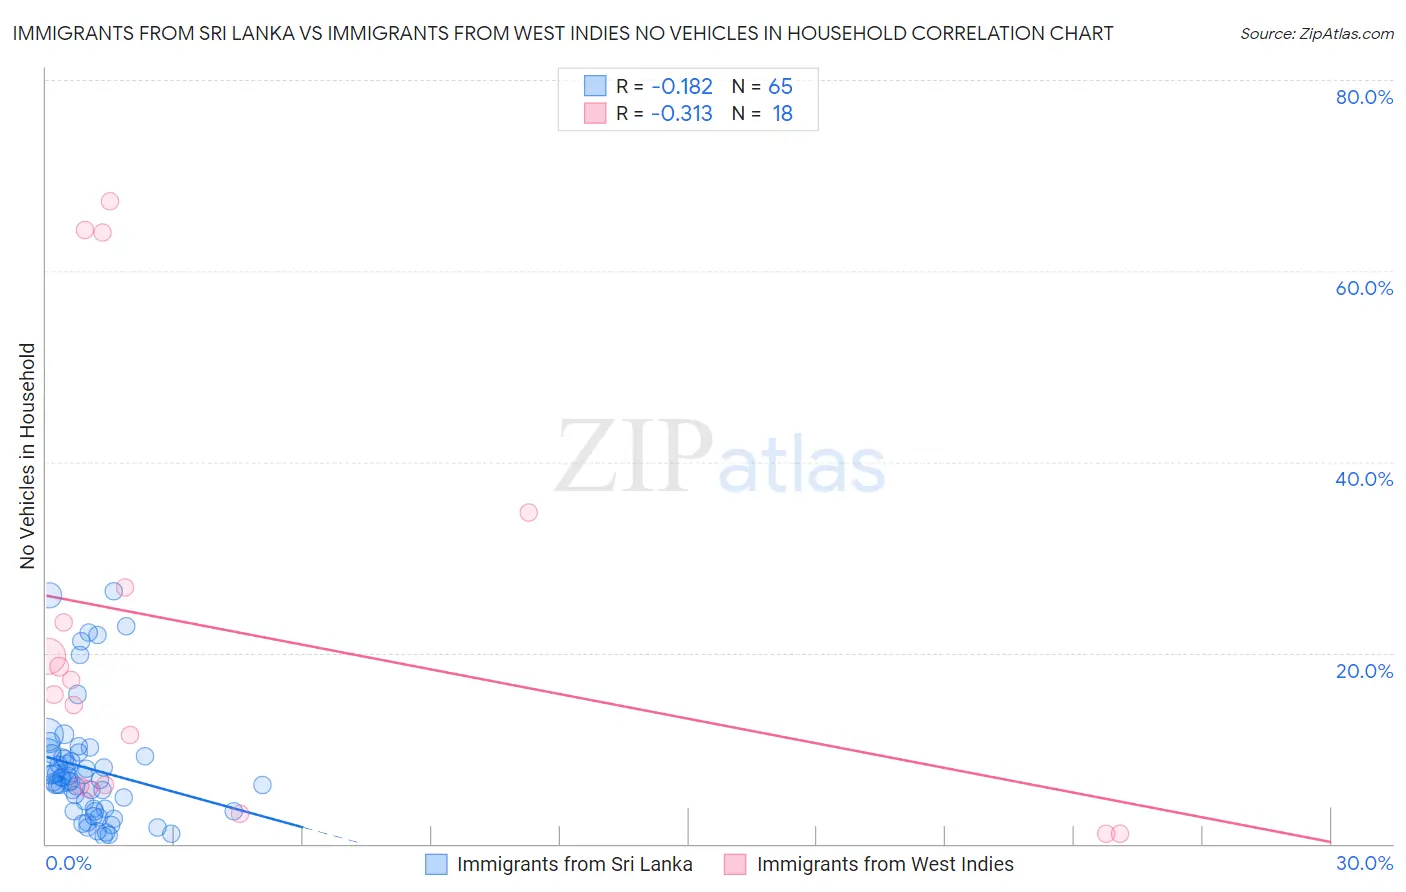
Immigrants from Sri Lanka vs Immigrants from West Indies No Vehicles in Household Correlation Chart
The statistical analysis conducted on geographies consisting of 149,629,473 people shows a poor negative correlation between the proportion of Immigrants from Sri Lanka and percentage of households with no vehicle available in the United States with a correlation coefficient (R) of -0.182 and weighted average of 11.2%. Similarly, the statistical analysis conducted on geographies consisting of 72,444,835 people shows a mild negative correlation between the proportion of Immigrants from West Indies and percentage of households with no vehicle available in the United States with a correlation coefficient (R) of -0.313 and weighted average of 20.5%, a difference of 84.1%.
No Vehicles in Household Correlation Summary
| Measurement | Immigrants from Sri Lanka | Immigrants from West Indies |
| Minimum | 0.78% | 1.0% |
| Maximum | 26.5% | 67.3% |
| Range | 25.7% | 66.3% |
| Mean | 7.9% | 22.2% |
| Median | 6.6% | 16.4% |
| Interquartile 25% (IQ1) | 3.5% | 6.0% |
| Interquartile 75% (IQ3) | 9.3% | 26.8% |
| Interquartile Range (IQR) | 5.7% | 20.8% |
| Standard Deviation (Sample) | 6.1% | 21.8% |
| Standard Deviation (Population) | 6.1% | 21.2% |
Similar Demographics by No Vehicles in Household
Demographics Similar to Immigrants from Sri Lanka by No Vehicles in Household
In terms of no vehicles in household, the demographic groups most similar to Immigrants from Sri Lanka are Immigrants from Argentina (11.2%, a difference of 0.0%), Dutch West Indian (11.2%, a difference of 0.13%), Immigrants from Guatemala (11.2%, a difference of 0.23%), Argentinean (11.2%, a difference of 0.35%), and Immigrants from Zaire (11.2%, a difference of 0.37%).
| Demographics | Rating | Rank | No Vehicles in Household |
| Immigrants | Italy | 15.6 /100 | #208 | Poor 11.0% |
| Pennsylvania Germans | 15.5 /100 | #209 | Poor 11.0% |
| Apache | 14.8 /100 | #210 | Poor 11.0% |
| Crow | 14.2 /100 | #211 | Poor 11.0% |
| Immigrants | Western Asia | 13.9 /100 | #212 | Poor 11.0% |
| Immigrants | Hungary | 12.3 /100 | #213 | Poor 11.1% |
| Immigrants | Denmark | 12.1 /100 | #214 | Poor 11.1% |
| Immigrants | Sri Lanka | 10.6 /100 | #215 | Poor 11.2% |
| Immigrants | Argentina | 10.6 /100 | #216 | Poor 11.2% |
| Dutch West Indians | 10.2 /100 | #217 | Poor 11.2% |
| Immigrants | Guatemala | 10.0 /100 | #218 | Tragic 11.2% |
| Argentineans | 9.6 /100 | #219 | Tragic 11.2% |
| Immigrants | Zaire | 9.6 /100 | #220 | Tragic 11.2% |
| Peruvians | 8.4 /100 | #221 | Tragic 11.2% |
| Immigrants | South America | 8.0 /100 | #222 | Tragic 11.3% |
Demographics Similar to Immigrants from West Indies by No Vehicles in Household
In terms of no vehicles in household, the demographic groups most similar to Immigrants from West Indies are Immigrants from Senegal (21.1%, a difference of 3.0%), Senegalese (19.8%, a difference of 3.9%), Immigrants from Caribbean (19.6%, a difference of 4.7%), Immigrants from Yemen (19.5%, a difference of 5.5%), and Immigrants from Dominica (22.2%, a difference of 8.3%).
| Demographics | Rating | Rank | No Vehicles in Household |
| Alaska Natives | 0.0 /100 | #319 | Tragic 17.4% |
| Soviet Union | 0.0 /100 | #320 | Tragic 17.4% |
| Jamaicans | 0.0 /100 | #321 | Tragic 17.9% |
| Immigrants | Cabo Verde | 0.0 /100 | #322 | Tragic 18.4% |
| Immigrants | Yemen | 0.0 /100 | #323 | Tragic 19.5% |
| Immigrants | Caribbean | 0.0 /100 | #324 | Tragic 19.6% |
| Senegalese | 0.0 /100 | #325 | Tragic 19.8% |
| Immigrants | West Indies | 0.0 /100 | #326 | Tragic 20.5% |
| Immigrants | Senegal | 0.0 /100 | #327 | Tragic 21.1% |
| Immigrants | Dominica | 0.0 /100 | #328 | Tragic 22.2% |
| Ecuadorians | 0.0 /100 | #329 | Tragic 22.8% |
| West Indians | 0.0 /100 | #330 | Tragic 23.7% |
| Trinidadians and Tobagonians | 0.0 /100 | #331 | Tragic 23.7% |
| Immigrants | Ecuador | 0.0 /100 | #332 | Tragic 23.8% |
| Immigrants | Trinidad and Tobago | 0.0 /100 | #333 | Tragic 24.6% |