Immigrants from Sri Lanka vs Afghan Householder Income Ages 25 - 44 years
COMPARE
Immigrants from Sri Lanka
Afghan
Householder Income Ages 25 - 44 years
Householder Income Ages 25 - 44 years Comparison
Immigrants from Sri Lanka
Afghans
$109,741
HOUSEHOLDER INCOME AGES 25 - 44 YEARS
100.0/ 100
METRIC RATING
32nd/ 347
METRIC RANK
$104,410
HOUSEHOLDER INCOME AGES 25 - 44 YEARS
99.6/ 100
METRIC RATING
71st/ 347
METRIC RANK
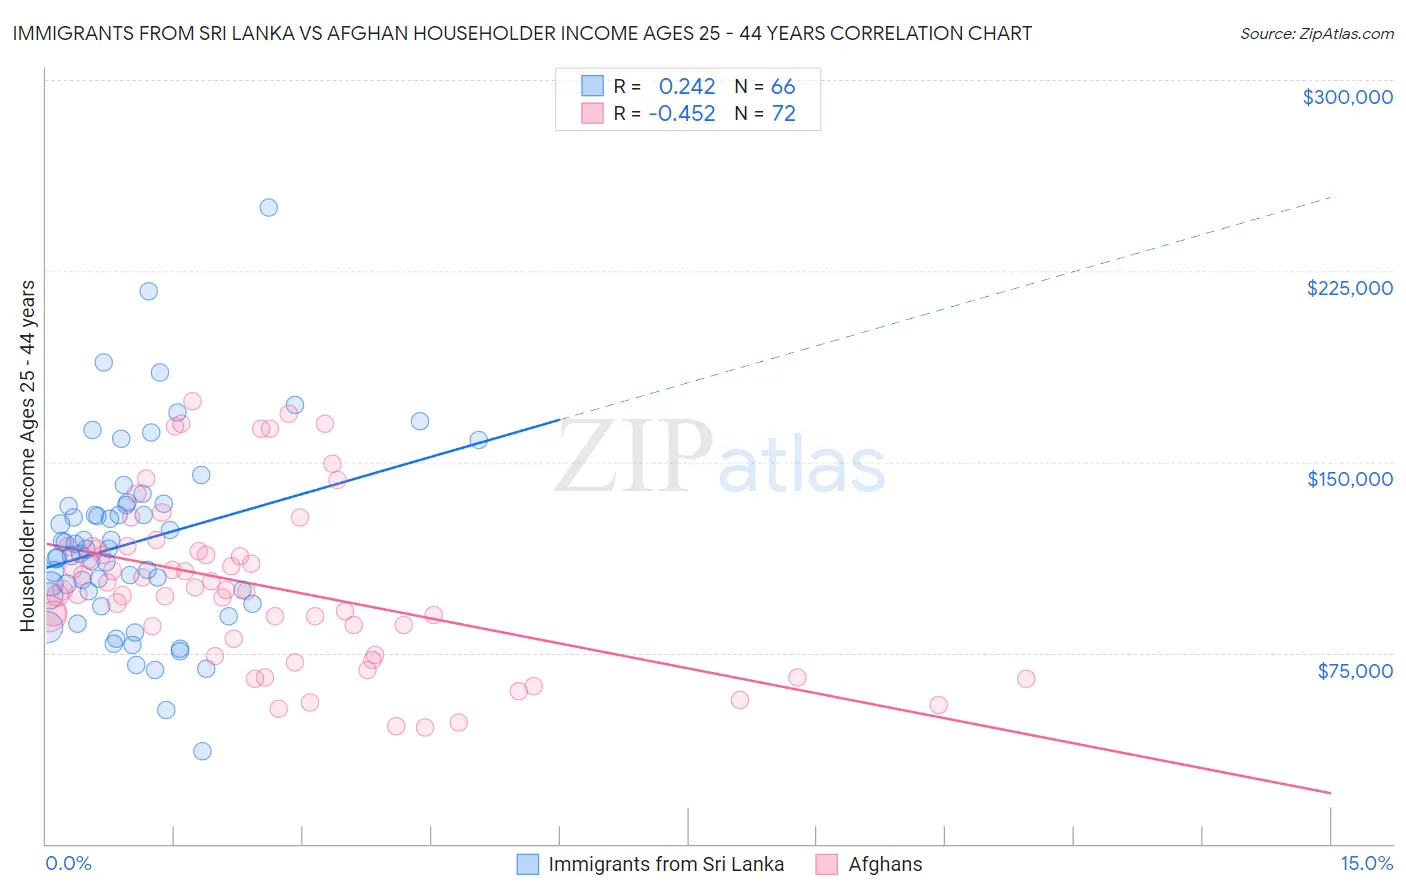
Immigrants from Sri Lanka vs Afghan Householder Income Ages 25 - 44 years Correlation Chart
The statistical analysis conducted on geographies consisting of 149,615,906 people shows a weak positive correlation between the proportion of Immigrants from Sri Lanka and household income with householder between the ages 25 and 44 in the United States with a correlation coefficient (R) of 0.242 and weighted average of $109,741. Similarly, the statistical analysis conducted on geographies consisting of 148,765,524 people shows a moderate negative correlation between the proportion of Afghans and household income with householder between the ages 25 and 44 in the United States with a correlation coefficient (R) of -0.452 and weighted average of $104,410, a difference of 5.1%.
Householder Income Ages 25 - 44 years Correlation Summary
| Measurement | Immigrants from Sri Lanka | Afghan |
| Minimum | $36,230 | $45,809 |
| Maximum | $250,001 | $173,653 |
| Range | $213,771 | $127,844 |
| Mean | $118,421 | $101,372 |
| Median | $114,758 | $99,588 |
| Interquartile 25% (IQ1) | $97,290 | $77,205 |
| Interquartile 75% (IQ3) | $133,038 | $116,400 |
| Interquartile Range (IQR) | $35,748 | $39,195 |
| Standard Deviation (Sample) | $37,121 | $32,218 |
| Standard Deviation (Population) | $36,839 | $31,993 |
Similar Demographics by Householder Income Ages 25 - 44 years
Demographics Similar to Immigrants from Sri Lanka by Householder Income Ages 25 - 44 years
In terms of householder income ages 25 - 44 years, the demographic groups most similar to Immigrants from Sri Lanka are Bhutanese ($109,520, a difference of 0.20%), Maltese ($110,064, a difference of 0.29%), Immigrants from Greece ($110,103, a difference of 0.33%), Bolivian ($109,372, a difference of 0.34%), and Immigrants from Switzerland ($109,185, a difference of 0.51%).
| Demographics | Rating | Rank | Householder Income Ages 25 - 44 years |
| Immigrants | Northern Europe | 100.0 /100 | #25 | Exceptional $111,676 |
| Immigrants | Asia | 100.0 /100 | #26 | Exceptional $110,787 |
| Russians | 100.0 /100 | #27 | Exceptional $110,398 |
| Immigrants | Denmark | 100.0 /100 | #28 | Exceptional $110,363 |
| Turks | 100.0 /100 | #29 | Exceptional $110,318 |
| Immigrants | Greece | 100.0 /100 | #30 | Exceptional $110,103 |
| Maltese | 100.0 /100 | #31 | Exceptional $110,064 |
| Immigrants | Sri Lanka | 100.0 /100 | #32 | Exceptional $109,741 |
| Bhutanese | 100.0 /100 | #33 | Exceptional $109,520 |
| Bolivians | 100.0 /100 | #34 | Exceptional $109,372 |
| Immigrants | Switzerland | 100.0 /100 | #35 | Exceptional $109,185 |
| Latvians | 100.0 /100 | #36 | Exceptional $108,926 |
| Immigrants | Russia | 100.0 /100 | #37 | Exceptional $108,751 |
| Soviet Union | 100.0 /100 | #38 | Exceptional $108,457 |
| Immigrants | France | 99.9 /100 | #39 | Exceptional $108,257 |
Demographics Similar to Afghans by Householder Income Ages 25 - 44 years
In terms of householder income ages 25 - 44 years, the demographic groups most similar to Afghans are Immigrants from Croatia ($104,503, a difference of 0.090%), Chinese ($104,264, a difference of 0.14%), Mongolian ($104,578, a difference of 0.16%), Italian ($104,215, a difference of 0.19%), and Immigrants from Eastern Europe ($104,662, a difference of 0.24%).
| Demographics | Rating | Rank | Householder Income Ages 25 - 44 years |
| New Zealanders | 99.7 /100 | #64 | Exceptional $105,085 |
| Immigrants | Netherlands | 99.7 /100 | #65 | Exceptional $105,082 |
| Laotians | 99.7 /100 | #66 | Exceptional $104,993 |
| Immigrants | Romania | 99.6 /100 | #67 | Exceptional $104,713 |
| Immigrants | Eastern Europe | 99.6 /100 | #68 | Exceptional $104,662 |
| Mongolians | 99.6 /100 | #69 | Exceptional $104,578 |
| Immigrants | Croatia | 99.6 /100 | #70 | Exceptional $104,503 |
| Afghans | 99.6 /100 | #71 | Exceptional $104,410 |
| Chinese | 99.5 /100 | #72 | Exceptional $104,264 |
| Italians | 99.5 /100 | #73 | Exceptional $104,215 |
| Immigrants | Fiji | 99.5 /100 | #74 | Exceptional $103,954 |
| Koreans | 99.4 /100 | #75 | Exceptional $103,824 |
| Immigrants | Spain | 99.4 /100 | #76 | Exceptional $103,752 |
| Immigrants | Southern Europe | 99.3 /100 | #77 | Exceptional $103,486 |
| Immigrants | Bulgaria | 99.3 /100 | #78 | Exceptional $103,423 |