Immigrants from Sri Lanka vs Immigrants from Brazil No Vehicles in Household
COMPARE
Immigrants from Sri Lanka
Immigrants from Brazil
No Vehicles in Household
No Vehicles in Household Comparison
Immigrants from Sri Lanka
Immigrants from Brazil
11.2%
NO VEHICLES IN HOUSEHOLD
10.6/ 100
METRIC RATING
215th/ 347
METRIC RANK
10.8%
NO VEHICLES IN HOUSEHOLD
26.3/ 100
METRIC RATING
195th/ 347
METRIC RANK
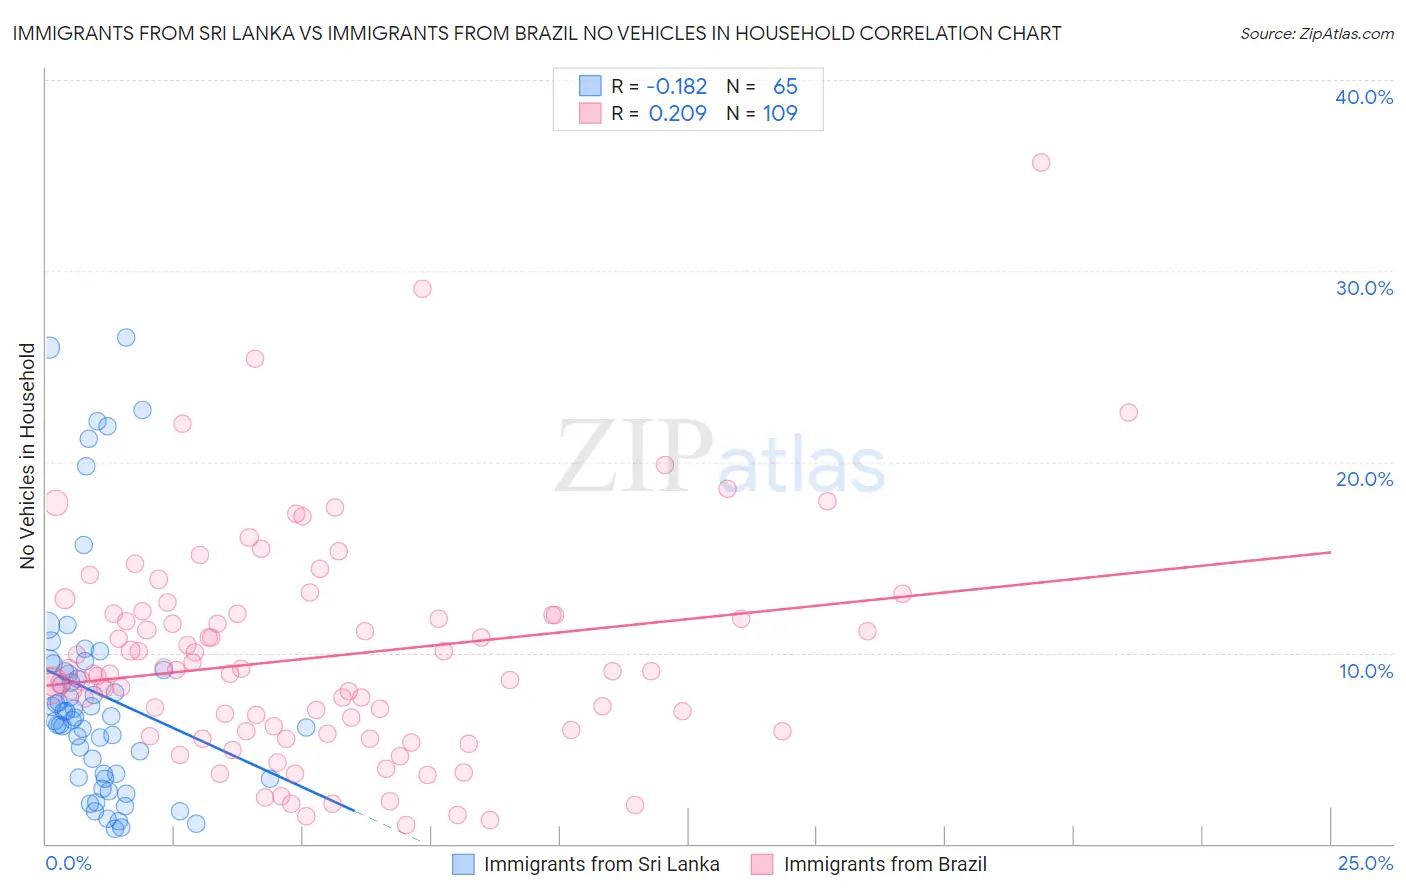
Immigrants from Sri Lanka vs Immigrants from Brazil No Vehicles in Household Correlation Chart
The statistical analysis conducted on geographies consisting of 149,629,473 people shows a poor negative correlation between the proportion of Immigrants from Sri Lanka and percentage of households with no vehicle available in the United States with a correlation coefficient (R) of -0.182 and weighted average of 11.2%. Similarly, the statistical analysis conducted on geographies consisting of 341,931,543 people shows a weak positive correlation between the proportion of Immigrants from Brazil and percentage of households with no vehicle available in the United States with a correlation coefficient (R) of 0.209 and weighted average of 10.8%, a difference of 3.6%.
No Vehicles in Household Correlation Summary
| Measurement | Immigrants from Sri Lanka | Immigrants from Brazil |
| Minimum | 0.78% | 0.95% |
| Maximum | 26.5% | 35.7% |
| Range | 25.7% | 34.7% |
| Mean | 7.9% | 9.8% |
| Median | 6.6% | 8.9% |
| Interquartile 25% (IQ1) | 3.5% | 5.9% |
| Interquartile 75% (IQ3) | 9.3% | 12.0% |
| Interquartile Range (IQR) | 5.7% | 6.1% |
| Standard Deviation (Sample) | 6.1% | 5.8% |
| Standard Deviation (Population) | 6.1% | 5.8% |
Demographics Similar to Immigrants from Sri Lanka and Immigrants from Brazil by No Vehicles in Household
In terms of no vehicles in household, the demographic groups most similar to Immigrants from Sri Lanka are Immigrants from Denmark (11.1%, a difference of 0.46%), Immigrants from Hungary (11.1%, a difference of 0.53%), Immigrants from Western Asia (11.0%, a difference of 0.97%), Crow (11.0%, a difference of 1.1%), and Apache (11.0%, a difference of 1.2%). Similarly, the demographic groups most similar to Immigrants from Brazil are Central American (10.8%, a difference of 0.34%), Shoshone (10.8%, a difference of 0.38%), Immigrants from Sweden (10.8%, a difference of 0.59%), Immigrants from Asia (10.9%, a difference of 0.90%), and Cambodian (10.9%, a difference of 1.2%).
| Demographics | Rating | Rank | No Vehicles in Household |
| Immigrants | Brazil | 26.3 /100 | #195 | Fair 10.8% |
| Central Americans | 24.3 /100 | #196 | Fair 10.8% |
| Shoshone | 24.1 /100 | #197 | Fair 10.8% |
| Immigrants | Sweden | 22.9 /100 | #198 | Fair 10.8% |
| Immigrants | Asia | 21.3 /100 | #199 | Fair 10.9% |
| Cambodians | 19.6 /100 | #200 | Poor 10.9% |
| Immigrants | Western Europe | 19.1 /100 | #201 | Poor 10.9% |
| Romanians | 17.9 /100 | #202 | Poor 10.9% |
| Iroquois | 17.6 /100 | #203 | Poor 10.9% |
| Guatemalans | 16.1 /100 | #204 | Poor 11.0% |
| Immigrants | Chile | 15.9 /100 | #205 | Poor 11.0% |
| Somalis | 15.9 /100 | #206 | Poor 11.0% |
| Sierra Leoneans | 15.7 /100 | #207 | Poor 11.0% |
| Immigrants | Italy | 15.6 /100 | #208 | Poor 11.0% |
| Pennsylvania Germans | 15.5 /100 | #209 | Poor 11.0% |
| Apache | 14.8 /100 | #210 | Poor 11.0% |
| Crow | 14.2 /100 | #211 | Poor 11.0% |
| Immigrants | Western Asia | 13.9 /100 | #212 | Poor 11.0% |
| Immigrants | Hungary | 12.3 /100 | #213 | Poor 11.1% |
| Immigrants | Denmark | 12.1 /100 | #214 | Poor 11.1% |
| Immigrants | Sri Lanka | 10.6 /100 | #215 | Poor 11.2% |