Immigrants from Sri Lanka vs Afghan Single Father Households
COMPARE
Immigrants from Sri Lanka
Afghan
Single Father Households
Single Father Households Comparison
Immigrants from Sri Lanka
Afghans
2.0%
SINGLE FATHER HOUSEHOLDS
100.0/ 100
METRIC RATING
39th/ 347
METRIC RANK
2.3%
SINGLE FATHER HOUSEHOLDS
50.0/ 100
METRIC RATING
174th/ 347
METRIC RANK
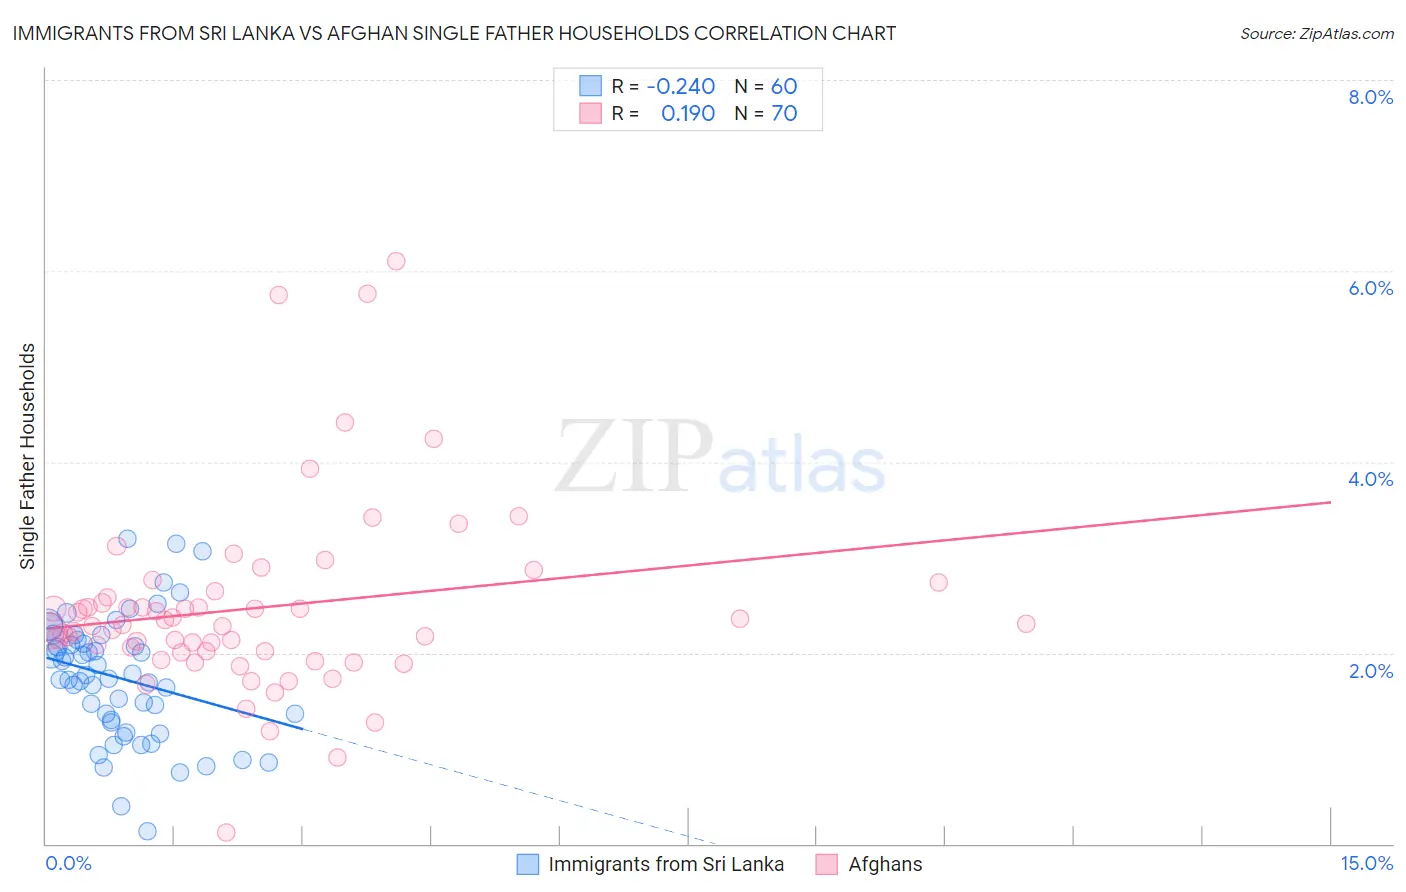
Immigrants from Sri Lanka vs Afghan Single Father Households Correlation Chart
The statistical analysis conducted on geographies consisting of 149,256,375 people shows a weak negative correlation between the proportion of Immigrants from Sri Lanka and percentage of single father households in the United States with a correlation coefficient (R) of -0.240 and weighted average of 2.0%. Similarly, the statistical analysis conducted on geographies consisting of 148,375,080 people shows a poor positive correlation between the proportion of Afghans and percentage of single father households in the United States with a correlation coefficient (R) of 0.190 and weighted average of 2.3%, a difference of 17.4%.
Single Father Households Correlation Summary
| Measurement | Immigrants from Sri Lanka | Afghan |
| Minimum | 0.13% | 0.11% |
| Maximum | 3.2% | 6.1% |
| Range | 3.1% | 6.0% |
| Mean | 1.7% | 2.5% |
| Median | 1.7% | 2.3% |
| Interquartile 25% (IQ1) | 1.3% | 2.0% |
| Interquartile 75% (IQ3) | 2.1% | 2.6% |
| Interquartile Range (IQR) | 0.83% | 0.57% |
| Standard Deviation (Sample) | 0.65% | 0.99% |
| Standard Deviation (Population) | 0.64% | 0.98% |
Similar Demographics by Single Father Households
Demographics Similar to Immigrants from Sri Lanka by Single Father Households
In terms of single father households, the demographic groups most similar to Immigrants from Sri Lanka are Immigrants from Eastern Europe (2.0%, a difference of 0.0%), Immigrants from Bulgaria (2.0%, a difference of 0.050%), Immigrants from Turkey (2.0%, a difference of 0.23%), Immigrants from St. Vincent and the Grenadines (2.0%, a difference of 0.30%), and Immigrants from Belgium (2.0%, a difference of 0.32%).
| Demographics | Rating | Rank | Single Father Households |
| Chinese | 100.0 /100 | #32 | Exceptional 2.0% |
| Turks | 100.0 /100 | #33 | Exceptional 2.0% |
| Immigrants | Australia | 100.0 /100 | #34 | Exceptional 2.0% |
| Albanians | 100.0 /100 | #35 | Exceptional 2.0% |
| Immigrants | Belgium | 100.0 /100 | #36 | Exceptional 2.0% |
| Immigrants | St. Vincent and the Grenadines | 100.0 /100 | #37 | Exceptional 2.0% |
| Immigrants | Eastern Europe | 100.0 /100 | #38 | Exceptional 2.0% |
| Immigrants | Sri Lanka | 100.0 /100 | #39 | Exceptional 2.0% |
| Immigrants | Bulgaria | 100.0 /100 | #40 | Exceptional 2.0% |
| Immigrants | Turkey | 100.0 /100 | #41 | Exceptional 2.0% |
| Macedonians | 100.0 /100 | #42 | Exceptional 2.0% |
| Immigrants | Grenada | 100.0 /100 | #43 | Exceptional 2.0% |
| Latvians | 100.0 /100 | #44 | Exceptional 2.0% |
| Russians | 100.0 /100 | #45 | Exceptional 2.0% |
| Immigrants | Lebanon | 100.0 /100 | #46 | Exceptional 2.0% |
Demographics Similar to Afghans by Single Father Households
In terms of single father households, the demographic groups most similar to Afghans are Immigrants from Jamaica (2.3%, a difference of 0.070%), Danish (2.3%, a difference of 0.13%), Colombian (2.3%, a difference of 0.14%), Celtic (2.3%, a difference of 0.40%), and Costa Rican (2.3%, a difference of 0.44%).
| Demographics | Rating | Rank | Single Father Households |
| South Americans | 64.3 /100 | #167 | Good 2.3% |
| Icelanders | 63.1 /100 | #168 | Good 2.3% |
| Czechs | 62.5 /100 | #169 | Good 2.3% |
| Ugandans | 62.2 /100 | #170 | Good 2.3% |
| Swedes | 61.6 /100 | #171 | Good 2.3% |
| Czechoslovakians | 58.9 /100 | #172 | Average 2.3% |
| Celtics | 55.4 /100 | #173 | Average 2.3% |
| Afghans | 50.0 /100 | #174 | Average 2.3% |
| Immigrants | Jamaica | 49.1 /100 | #175 | Average 2.3% |
| Danes | 48.2 /100 | #176 | Average 2.3% |
| Colombians | 48.0 /100 | #177 | Average 2.3% |
| Costa Ricans | 44.1 /100 | #178 | Average 2.3% |
| Welsh | 44.0 /100 | #179 | Average 2.3% |
| Yugoslavians | 43.9 /100 | #180 | Average 2.3% |
| Jamaicans | 43.5 /100 | #181 | Average 2.3% |