Immigrants from Southern Europe vs Tongan 2nd Grade
COMPARE
Immigrants from Southern Europe
Tongan
2nd Grade
2nd Grade Comparison
Immigrants from Southern Europe
Tongans
97.8%
2ND GRADE
18.1/ 100
METRIC RATING
205th/ 347
METRIC RANK
97.6%
2ND GRADE
4.3/ 100
METRIC RATING
225th/ 347
METRIC RANK
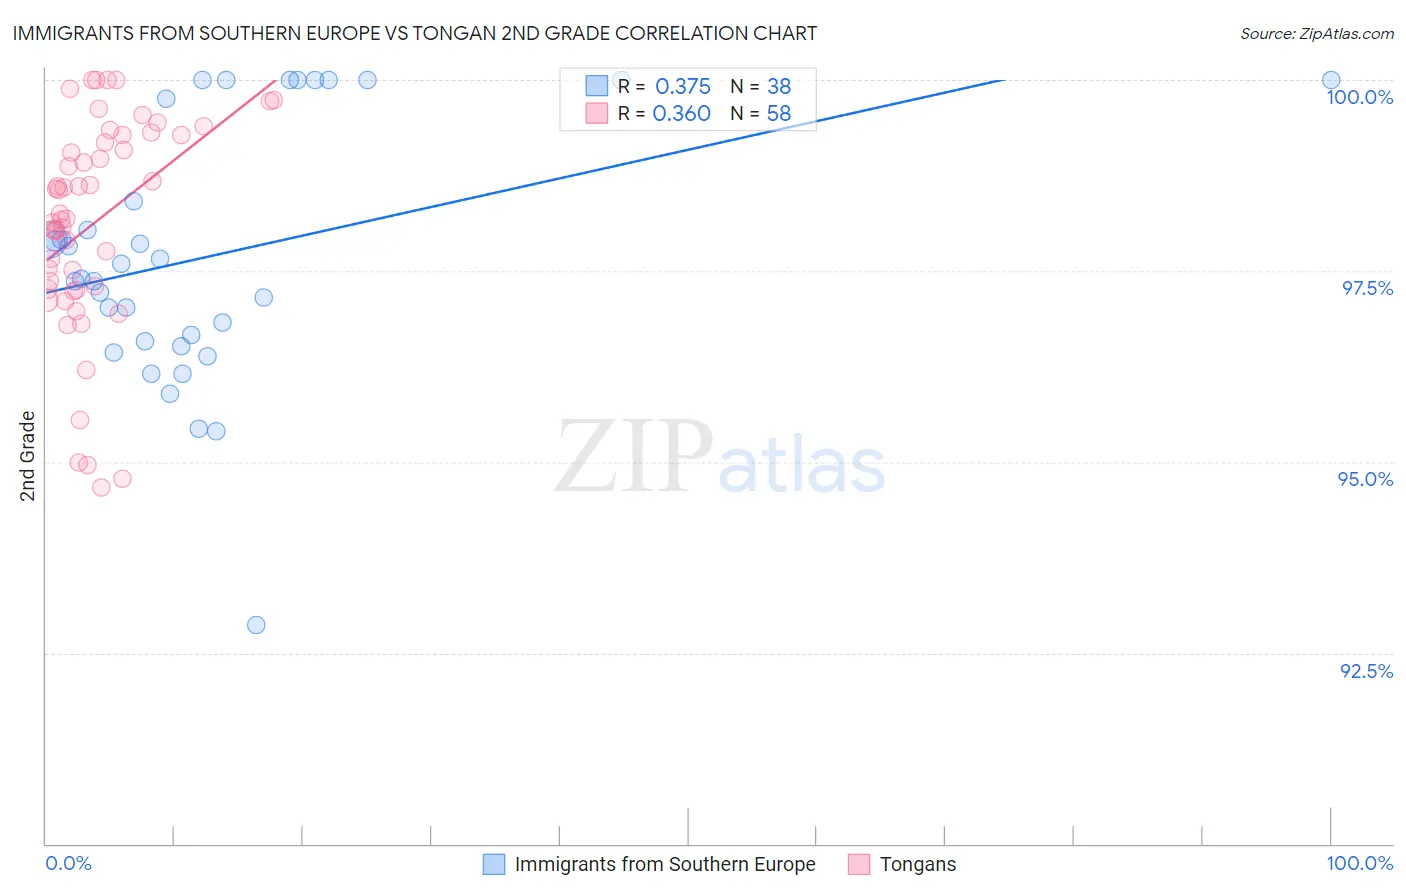
Immigrants from Southern Europe vs Tongan 2nd Grade Correlation Chart
The statistical analysis conducted on geographies consisting of 402,804,595 people shows a mild positive correlation between the proportion of Immigrants from Southern Europe and percentage of population with at least 2nd grade education in the United States with a correlation coefficient (R) of 0.375 and weighted average of 97.8%. Similarly, the statistical analysis conducted on geographies consisting of 102,908,759 people shows a mild positive correlation between the proportion of Tongans and percentage of population with at least 2nd grade education in the United States with a correlation coefficient (R) of 0.360 and weighted average of 97.6%, a difference of 0.13%.
2nd Grade Correlation Summary
| Measurement | Immigrants from Southern Europe | Tongan |
| Minimum | 92.9% | 94.7% |
| Maximum | 100.0% | 100.0% |
| Range | 7.1% | 5.3% |
| Mean | 97.7% | 98.1% |
| Median | 97.5% | 98.2% |
| Interquartile 25% (IQ1) | 96.6% | 97.3% |
| Interquartile 75% (IQ3) | 99.8% | 99.3% |
| Interquartile Range (IQR) | 3.2% | 2.0% |
| Standard Deviation (Sample) | 1.7% | 1.4% |
| Standard Deviation (Population) | 1.7% | 1.4% |
Demographics Similar to Immigrants from Southern Europe and Tongans by 2nd Grade
In terms of 2nd grade, the demographic groups most similar to Immigrants from Southern Europe are Immigrants from Chile (97.7%, a difference of 0.0%), African (97.7%, a difference of 0.010%), Immigrants from Northern Africa (97.7%, a difference of 0.040%), Immigrants from Oceania (97.7%, a difference of 0.050%), and Costa Rican (97.7%, a difference of 0.050%). Similarly, the demographic groups most similar to Tongans are Immigrants from Sudan (97.6%, a difference of 0.0%), Sierra Leonean (97.6%, a difference of 0.0%), Immigrants from Zaire (97.6%, a difference of 0.0%), Immigrants from Morocco (97.6%, a difference of 0.010%), and Iraqi (97.6%, a difference of 0.010%).
| Demographics | Rating | Rank | 2nd Grade |
| Immigrants | Southern Europe | 18.1 /100 | #205 | Poor 97.8% |
| Immigrants | Chile | 17.3 /100 | #206 | Poor 97.7% |
| Africans | 15.6 /100 | #207 | Poor 97.7% |
| Immigrants | Northern Africa | 12.3 /100 | #208 | Poor 97.7% |
| Immigrants | Oceania | 10.9 /100 | #209 | Poor 97.7% |
| Costa Ricans | 10.5 /100 | #210 | Poor 97.7% |
| Laotians | 9.9 /100 | #211 | Tragic 97.7% |
| Immigrants | Bahamas | 8.4 /100 | #212 | Tragic 97.7% |
| Moroccans | 8.2 /100 | #213 | Tragic 97.7% |
| Samoans | 7.1 /100 | #214 | Tragic 97.7% |
| Bahamians | 6.8 /100 | #215 | Tragic 97.7% |
| South American Indians | 6.7 /100 | #216 | Tragic 97.7% |
| Uruguayans | 6.2 /100 | #217 | Tragic 97.7% |
| Sudanese | 5.7 /100 | #218 | Tragic 97.7% |
| Immigrants | Panama | 5.1 /100 | #219 | Tragic 97.6% |
| Immigrants | Morocco | 5.0 /100 | #220 | Tragic 97.6% |
| Iraqis | 4.6 /100 | #221 | Tragic 97.6% |
| Immigrants | Sudan | 4.5 /100 | #222 | Tragic 97.6% |
| Sierra Leoneans | 4.3 /100 | #223 | Tragic 97.6% |
| Immigrants | Zaire | 4.3 /100 | #224 | Tragic 97.6% |
| Tongans | 4.3 /100 | #225 | Tragic 97.6% |