Immigrants from Southern Europe vs Tongan Median Household Income
COMPARE
Immigrants from Southern Europe
Tongan
Median Household Income
Median Household Income Comparison
Immigrants from Southern Europe
Tongans
$91,605
MEDIAN HOUSEHOLD INCOME
98.5/ 100
METRIC RATING
98th/ 347
METRIC RANK
$93,076
MEDIAN HOUSEHOLD INCOME
99.4/ 100
METRIC RATING
80th/ 347
METRIC RANK
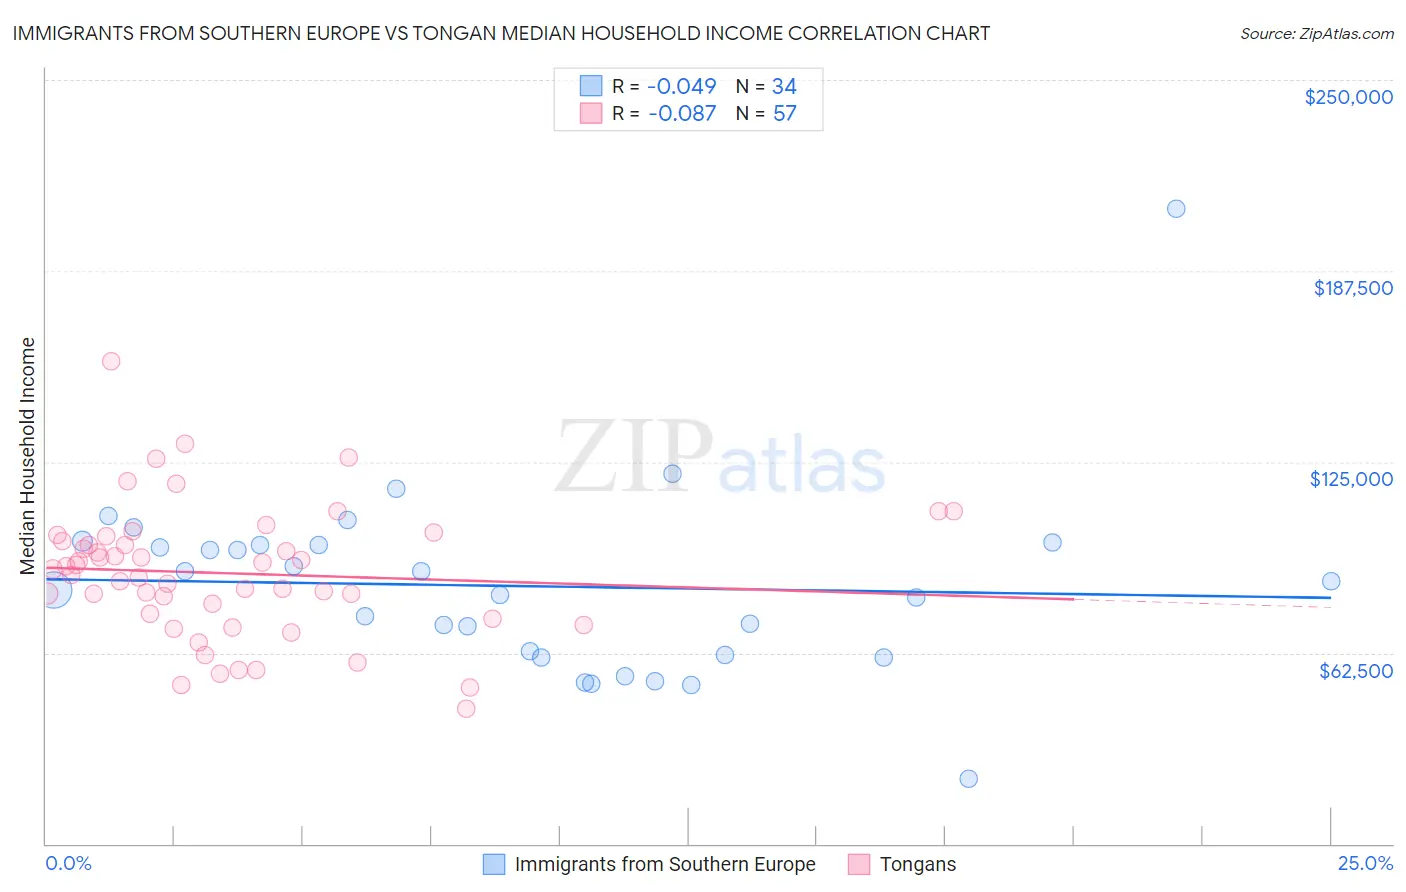
Immigrants from Southern Europe vs Tongan Median Household Income Correlation Chart
The statistical analysis conducted on geographies consisting of 402,553,568 people shows no correlation between the proportion of Immigrants from Southern Europe and median household income in the United States with a correlation coefficient (R) of -0.049 and weighted average of $91,605. Similarly, the statistical analysis conducted on geographies consisting of 102,857,692 people shows a slight negative correlation between the proportion of Tongans and median household income in the United States with a correlation coefficient (R) of -0.087 and weighted average of $93,076, a difference of 1.6%.
Median Household Income Correlation Summary
| Measurement | Immigrants from Southern Europe | Tongan |
| Minimum | $21,344 | $44,375 |
| Maximum | $207,878 | $157,875 |
| Range | $186,534 | $113,500 |
| Mean | $84,332 | $88,526 |
| Median | $84,460 | $89,840 |
| Interquartile 25% (IQ1) | $61,987 | $74,550 |
| Interquartile 75% (IQ3) | $97,991 | $99,865 |
| Interquartile Range (IQR) | $36,004 | $25,315 |
| Standard Deviation (Sample) | $31,079 | $21,499 |
| Standard Deviation (Population) | $30,619 | $21,310 |
Demographics Similar to Immigrants from Southern Europe and Tongans by Median Household Income
In terms of median household income, the demographic groups most similar to Immigrants from Southern Europe are Immigrants from South Eastern Asia ($91,541, a difference of 0.070%), Immigrants from Serbia ($91,730, a difference of 0.14%), Jordanian ($91,794, a difference of 0.21%), Armenian ($91,807, a difference of 0.22%), and Immigrants from North America ($91,860, a difference of 0.28%). Similarly, the demographic groups most similar to Tongans are Sri Lankan ($93,093, a difference of 0.020%), Immigrants from Eastern Europe ($93,051, a difference of 0.030%), Immigrants from Spain ($92,732, a difference of 0.37%), Italian ($92,475, a difference of 0.65%), and Immigrants from Argentina ($92,417, a difference of 0.71%).
| Demographics | Rating | Rank | Median Household Income |
| Sri Lankans | 99.4 /100 | #79 | Exceptional $93,093 |
| Tongans | 99.4 /100 | #80 | Exceptional $93,076 |
| Immigrants | Eastern Europe | 99.4 /100 | #81 | Exceptional $93,051 |
| Immigrants | Spain | 99.3 /100 | #82 | Exceptional $92,732 |
| Italians | 99.1 /100 | #83 | Exceptional $92,475 |
| Immigrants | Argentina | 99.1 /100 | #84 | Exceptional $92,417 |
| Immigrants | Croatia | 99.0 /100 | #85 | Exceptional $92,225 |
| Immigrants | England | 98.9 /100 | #86 | Exceptional $92,098 |
| Immigrants | Hungary | 98.9 /100 | #87 | Exceptional $92,094 |
| Immigrants | Canada | 98.8 /100 | #88 | Exceptional $92,029 |
| Romanians | 98.8 /100 | #89 | Exceptional $91,994 |
| Assyrians/Chaldeans/Syriacs | 98.8 /100 | #90 | Exceptional $91,991 |
| Immigrants | Vietnam | 98.8 /100 | #91 | Exceptional $91,987 |
| Immigrants | Western Europe | 98.8 /100 | #92 | Exceptional $91,936 |
| Immigrants | Lebanon | 98.7 /100 | #93 | Exceptional $91,887 |
| Immigrants | North America | 98.7 /100 | #94 | Exceptional $91,860 |
| Armenians | 98.7 /100 | #95 | Exceptional $91,807 |
| Jordanians | 98.7 /100 | #96 | Exceptional $91,794 |
| Immigrants | Serbia | 98.6 /100 | #97 | Exceptional $91,730 |
| Immigrants | Southern Europe | 98.5 /100 | #98 | Exceptional $91,605 |
| Immigrants | South Eastern Asia | 98.4 /100 | #99 | Exceptional $91,541 |