Welsh vs Immigrants from Bangladesh 3 or more Vehicles in Household
COMPARE
Welsh
Immigrants from Bangladesh
3 or more Vehicles in Household
3 or more Vehicles in Household Comparison
Welsh
Immigrants from Bangladesh
22.6%
3 OR MORE VEHICLES IN HOUSEHOLD
100.0/ 100
METRIC RATING
52nd/ 347
METRIC RANK
12.5%
3 OR MORE VEHICLES IN HOUSEHOLD
0.0/ 100
METRIC RATING
337th/ 347
METRIC RANK
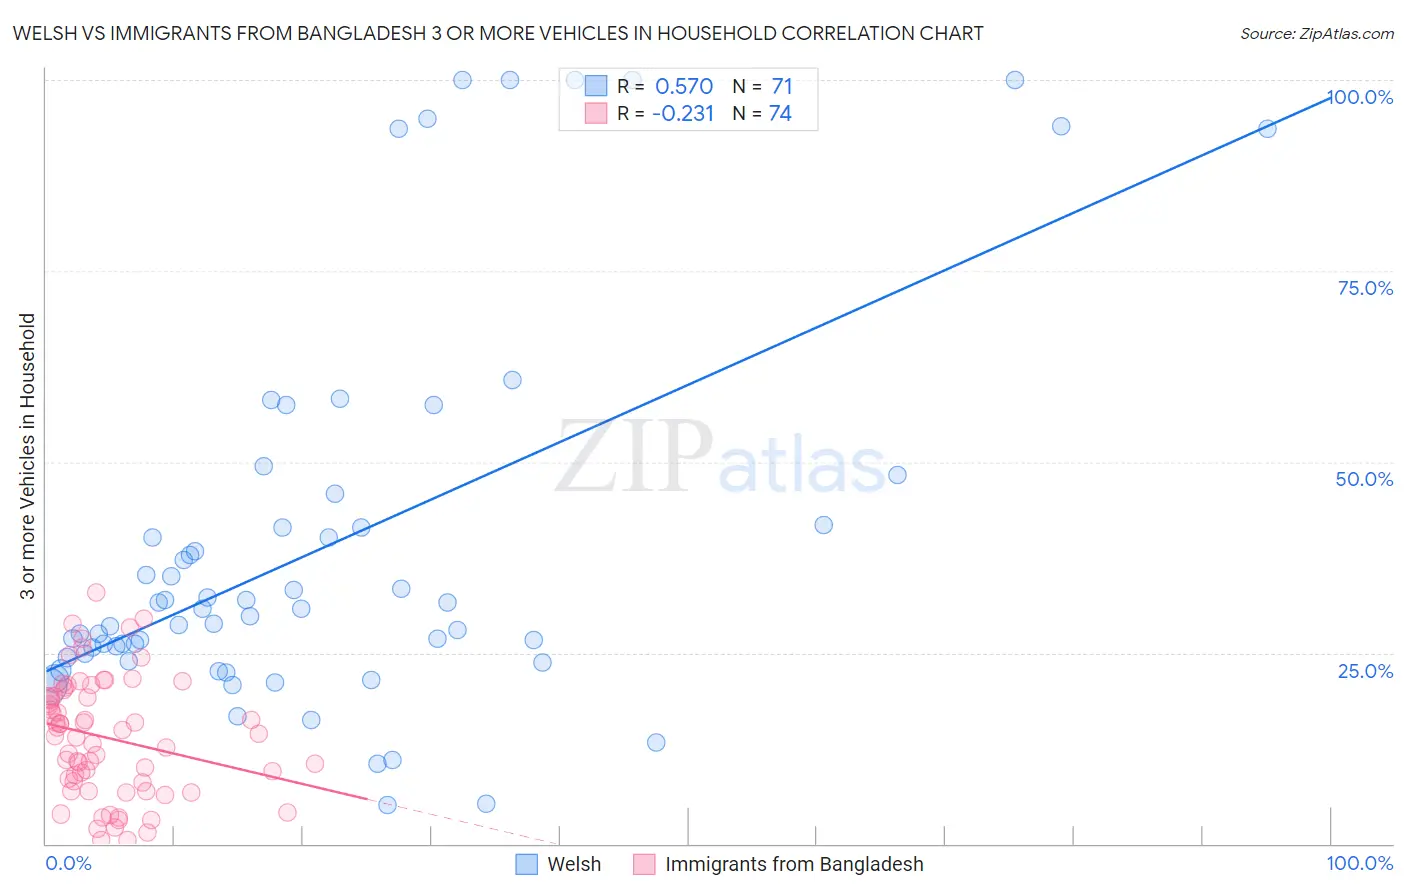
Welsh vs Immigrants from Bangladesh 3 or more Vehicles in Household Correlation Chart
The statistical analysis conducted on geographies consisting of 528,014,729 people shows a substantial positive correlation between the proportion of Welsh and percentage of households with 3 or more vehicles available in the United States with a correlation coefficient (R) of 0.570 and weighted average of 22.6%. Similarly, the statistical analysis conducted on geographies consisting of 203,530,312 people shows a weak negative correlation between the proportion of Immigrants from Bangladesh and percentage of households with 3 or more vehicles available in the United States with a correlation coefficient (R) of -0.231 and weighted average of 12.5%, a difference of 80.3%.
3 or more Vehicles in Household Correlation Summary
| Measurement | Welsh | Immigrants from Bangladesh |
| Minimum | 5.1% | 0.43% |
| Maximum | 100.0% | 33.0% |
| Range | 94.9% | 32.5% |
| Mean | 39.0% | 13.9% |
| Median | 30.7% | 14.2% |
| Interquartile 25% (IQ1) | 24.3% | 8.0% |
| Interquartile 75% (IQ3) | 41.7% | 19.4% |
| Interquartile Range (IQR) | 17.3% | 11.4% |
| Standard Deviation (Sample) | 25.2% | 7.8% |
| Standard Deviation (Population) | 25.0% | 7.7% |
Similar Demographics by 3 or more Vehicles in Household
Demographics Similar to Welsh by 3 or more Vehicles in Household
In terms of 3 or more vehicles in household, the demographic groups most similar to Welsh are White/Caucasian (22.6%, a difference of 0.040%), Sioux (22.6%, a difference of 0.050%), Scotch-Irish (22.6%, a difference of 0.11%), Scottish (22.6%, a difference of 0.21%), and Malaysian (22.6%, a difference of 0.22%).
| Demographics | Rating | Rank | 3 or more Vehicles in Household |
| Ute | 100.0 /100 | #45 | Exceptional 22.7% |
| Americans | 100.0 /100 | #46 | Exceptional 22.6% |
| Malaysians | 100.0 /100 | #47 | Exceptional 22.6% |
| Scottish | 100.0 /100 | #48 | Exceptional 22.6% |
| Scotch-Irish | 100.0 /100 | #49 | Exceptional 22.6% |
| Sioux | 100.0 /100 | #50 | Exceptional 22.6% |
| Whites/Caucasians | 100.0 /100 | #51 | Exceptional 22.6% |
| Welsh | 100.0 /100 | #52 | Exceptional 22.6% |
| Czechs | 100.0 /100 | #53 | Exceptional 22.5% |
| Crow | 100.0 /100 | #54 | Exceptional 22.5% |
| Immigrants | Laos | 100.0 /100 | #55 | Exceptional 22.4% |
| Hispanics or Latinos | 100.0 /100 | #56 | Exceptional 22.4% |
| Pennsylvania Germans | 100.0 /100 | #57 | Exceptional 22.3% |
| Spaniards | 100.0 /100 | #58 | Exceptional 22.3% |
| Navajo | 100.0 /100 | #59 | Exceptional 22.3% |
Demographics Similar to Immigrants from Bangladesh by 3 or more Vehicles in Household
In terms of 3 or more vehicles in household, the demographic groups most similar to Immigrants from Bangladesh are Barbadian (12.6%, a difference of 0.44%), Vietnamese (12.5%, a difference of 0.54%), Immigrants from Uzbekistan (12.0%, a difference of 4.4%), Immigrants from Trinidad and Tobago (13.3%, a difference of 6.6%), and Immigrants from Barbados (11.7%, a difference of 6.8%).
| Demographics | Rating | Rank | 3 or more Vehicles in Household |
| West Indians | 0.0 /100 | #330 | Tragic 13.7% |
| Immigrants | Dominica | 0.0 /100 | #331 | Tragic 13.7% |
| Trinidadians and Tobagonians | 0.0 /100 | #332 | Tragic 13.6% |
| Immigrants | Cabo Verde | 0.0 /100 | #333 | Tragic 13.6% |
| Immigrants | Ecuador | 0.0 /100 | #334 | Tragic 13.4% |
| Immigrants | Trinidad and Tobago | 0.0 /100 | #335 | Tragic 13.3% |
| Barbadians | 0.0 /100 | #336 | Tragic 12.6% |
| Immigrants | Bangladesh | 0.0 /100 | #337 | Tragic 12.5% |
| Vietnamese | 0.0 /100 | #338 | Tragic 12.5% |
| Immigrants | Uzbekistan | 0.0 /100 | #339 | Tragic 12.0% |
| Immigrants | Barbados | 0.0 /100 | #340 | Tragic 11.7% |
| Guyanese | 0.0 /100 | #341 | Tragic 11.5% |
| British West Indians | 0.0 /100 | #342 | Tragic 11.4% |
| Immigrants | Guyana | 0.0 /100 | #343 | Tragic 11.2% |
| Dominicans | 0.0 /100 | #344 | Tragic 11.2% |