Immigrants from South Central Asia vs Ecuadorian College, 1 year or more
COMPARE
Immigrants from South Central Asia
Ecuadorian
College, 1 year or more
College, 1 year or more Comparison
Immigrants from South Central Asia
Ecuadorians
67.1%
COLLEGE, 1 YEAR OR MORE
100.0/ 100
METRIC RATING
11th/ 347
METRIC RANK
54.3%
COLLEGE, 1 YEAR OR MORE
0.2/ 100
METRIC RATING
277th/ 347
METRIC RANK
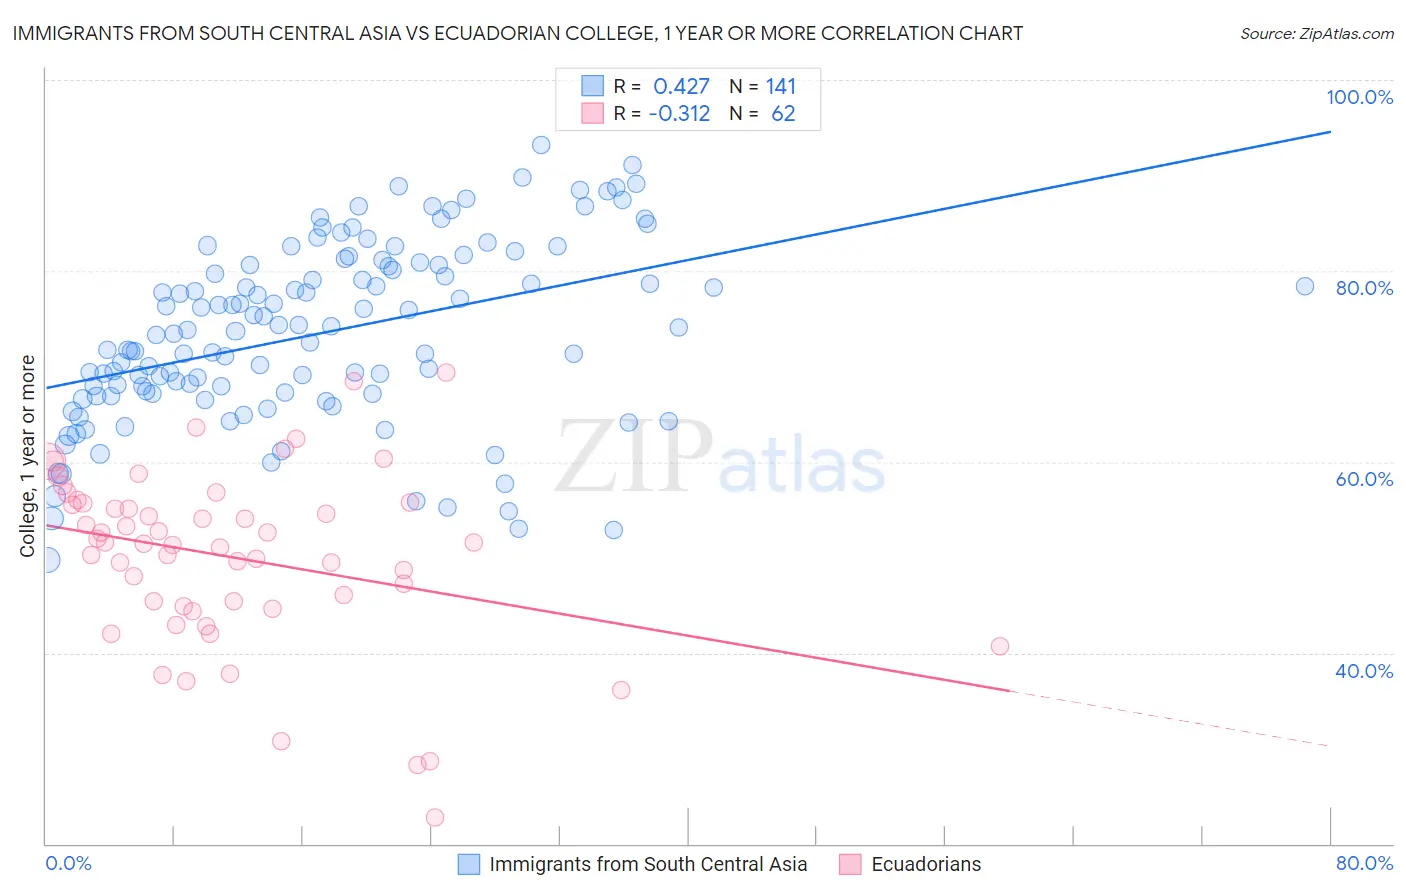
Immigrants from South Central Asia vs Ecuadorian College, 1 year or more Correlation Chart
The statistical analysis conducted on geographies consisting of 473,108,893 people shows a moderate positive correlation between the proportion of Immigrants from South Central Asia and percentage of population with at least college, 1 year or more education in the United States with a correlation coefficient (R) of 0.427 and weighted average of 67.1%. Similarly, the statistical analysis conducted on geographies consisting of 317,865,755 people shows a mild negative correlation between the proportion of Ecuadorians and percentage of population with at least college, 1 year or more education in the United States with a correlation coefficient (R) of -0.312 and weighted average of 54.3%, a difference of 23.6%.
College, 1 year or more Correlation Summary
| Measurement | Immigrants from South Central Asia | Ecuadorian |
| Minimum | 49.7% | 22.7% |
| Maximum | 93.2% | 69.4% |
| Range | 43.5% | 46.6% |
| Mean | 73.4% | 50.0% |
| Median | 73.7% | 51.5% |
| Interquartile 25% (IQ1) | 67.1% | 44.9% |
| Interquartile 75% (IQ3) | 80.6% | 55.7% |
| Interquartile Range (IQR) | 13.4% | 10.7% |
| Standard Deviation (Sample) | 9.4% | 9.3% |
| Standard Deviation (Population) | 9.3% | 9.2% |
Similar Demographics by College, 1 year or more
Demographics Similar to Immigrants from South Central Asia by College, 1 year or more
In terms of college, 1 year or more, the demographic groups most similar to Immigrants from South Central Asia are Cypriot (67.0%, a difference of 0.17%), Immigrants from Sweden (66.8%, a difference of 0.48%), Burmese (66.7%, a difference of 0.67%), Cambodian (66.7%, a difference of 0.67%), and Immigrants from Japan (66.7%, a difference of 0.71%).
| Demographics | Rating | Rank | College, 1 year or more |
| Immigrants | Taiwan | 100.0 /100 | #4 | Exceptional 69.6% |
| Immigrants | India | 100.0 /100 | #5 | Exceptional 69.6% |
| Immigrants | Iran | 100.0 /100 | #6 | Exceptional 69.5% |
| Okinawans | 100.0 /100 | #7 | Exceptional 69.0% |
| Thais | 100.0 /100 | #8 | Exceptional 68.6% |
| Immigrants | Israel | 100.0 /100 | #9 | Exceptional 67.8% |
| Immigrants | Australia | 100.0 /100 | #10 | Exceptional 67.7% |
| Immigrants | South Central Asia | 100.0 /100 | #11 | Exceptional 67.1% |
| Cypriots | 100.0 /100 | #12 | Exceptional 67.0% |
| Immigrants | Sweden | 100.0 /100 | #13 | Exceptional 66.8% |
| Burmese | 100.0 /100 | #14 | Exceptional 66.7% |
| Cambodians | 100.0 /100 | #15 | Exceptional 66.7% |
| Immigrants | Japan | 100.0 /100 | #16 | Exceptional 66.7% |
| Immigrants | Eastern Asia | 100.0 /100 | #17 | Exceptional 66.6% |
| Eastern Europeans | 100.0 /100 | #18 | Exceptional 66.6% |
Demographics Similar to Ecuadorians by College, 1 year or more
In terms of college, 1 year or more, the demographic groups most similar to Ecuadorians are Shoshone (54.3%, a difference of 0.040%), American (54.4%, a difference of 0.12%), Belizean (54.4%, a difference of 0.15%), Immigrants from Grenada (54.4%, a difference of 0.19%), and Comanche (54.4%, a difference of 0.22%).
| Demographics | Rating | Rank | College, 1 year or more |
| Crow | 0.2 /100 | #270 | Tragic 54.5% |
| Bahamians | 0.2 /100 | #271 | Tragic 54.5% |
| Comanche | 0.2 /100 | #272 | Tragic 54.4% |
| Immigrants | Grenada | 0.2 /100 | #273 | Tragic 54.4% |
| Belizeans | 0.2 /100 | #274 | Tragic 54.4% |
| Americans | 0.2 /100 | #275 | Tragic 54.4% |
| Shoshone | 0.2 /100 | #276 | Tragic 54.3% |
| Ecuadorians | 0.2 /100 | #277 | Tragic 54.3% |
| Immigrants | Jamaica | 0.1 /100 | #278 | Tragic 54.2% |
| Arapaho | 0.1 /100 | #279 | Tragic 54.1% |
| Cheyenne | 0.1 /100 | #280 | Tragic 54.1% |
| Colville | 0.1 /100 | #281 | Tragic 54.1% |
| Guyanese | 0.1 /100 | #282 | Tragic 54.1% |
| Nicaraguans | 0.1 /100 | #283 | Tragic 53.9% |
| Ute | 0.1 /100 | #284 | Tragic 53.8% |