Immigrants from Somalia vs Immigrants from Zimbabwe 1 or more Vehicles in Household
COMPARE
Immigrants from Somalia
Immigrants from Zimbabwe
1 or more Vehicles in Household
1 or more Vehicles in Household Comparison
Immigrants from Somalia
Immigrants from Zimbabwe
88.6%
1 OR MORE VEHICLES IN HOUSEHOLD
4.2/ 100
METRIC RATING
238th/ 347
METRIC RANK
90.2%
1 OR MORE VEHICLES IN HOUSEHOLD
81.5/ 100
METRIC RATING
144th/ 347
METRIC RANK
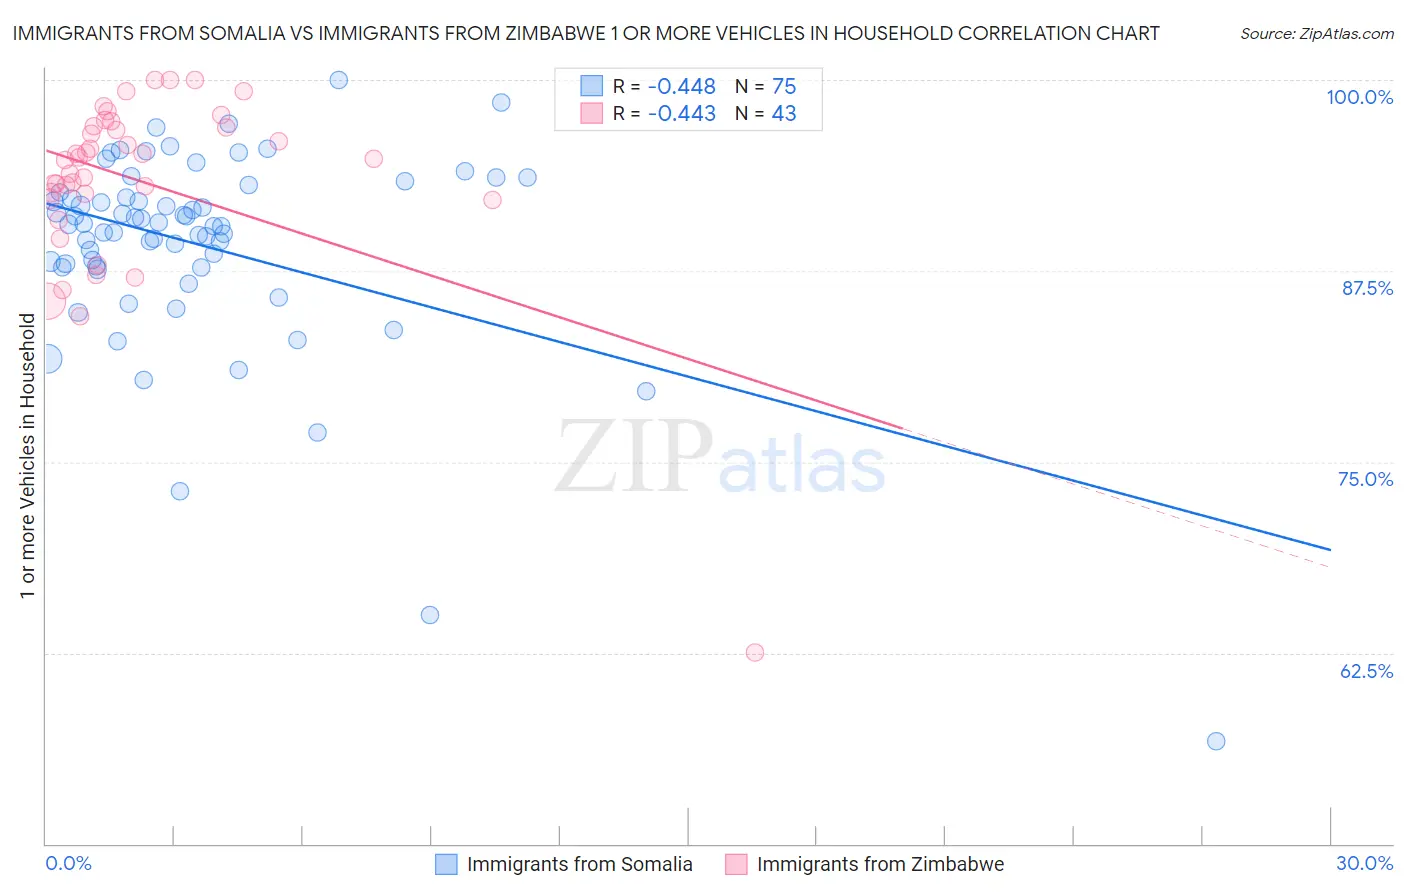
Immigrants from Somalia vs Immigrants from Zimbabwe 1 or more Vehicles in Household Correlation Chart
The statistical analysis conducted on geographies consisting of 92,102,978 people shows a moderate negative correlation between the proportion of Immigrants from Somalia and percentage of households with 1 or more vehicles available in the United States with a correlation coefficient (R) of -0.448 and weighted average of 88.6%. Similarly, the statistical analysis conducted on geographies consisting of 117,752,092 people shows a moderate negative correlation between the proportion of Immigrants from Zimbabwe and percentage of households with 1 or more vehicles available in the United States with a correlation coefficient (R) of -0.443 and weighted average of 90.2%, a difference of 1.8%.
1 or more Vehicles in Household Correlation Summary
| Measurement | Immigrants from Somalia | Immigrants from Zimbabwe |
| Minimum | 56.7% | 62.5% |
| Maximum | 100.0% | 100.0% |
| Range | 43.3% | 37.5% |
| Mean | 89.2% | 93.4% |
| Median | 90.5% | 94.9% |
| Interquartile 25% (IQ1) | 87.7% | 92.2% |
| Interquartile 75% (IQ3) | 92.6% | 97.0% |
| Interquartile Range (IQR) | 4.9% | 4.8% |
| Standard Deviation (Sample) | 6.8% | 6.3% |
| Standard Deviation (Population) | 6.7% | 6.2% |
Similar Demographics by 1 or more Vehicles in Household
Demographics Similar to Immigrants from Somalia by 1 or more Vehicles in Household
In terms of 1 or more vehicles in household, the demographic groups most similar to Immigrants from Somalia are Immigrants from Turkey (88.6%, a difference of 0.020%), Immigrants from Pakistan (88.6%, a difference of 0.030%), Paiute (88.6%, a difference of 0.040%), Kiowa (88.6%, a difference of 0.040%), and Immigrants from Peru (88.6%, a difference of 0.050%).
| Demographics | Rating | Rank | 1 or more Vehicles in Household |
| Russians | 5.0 /100 | #231 | Tragic 88.7% |
| Immigrants | Japan | 4.9 /100 | #232 | Tragic 88.7% |
| Houma | 4.8 /100 | #233 | Tragic 88.6% |
| Immigrants | Peru | 4.7 /100 | #234 | Tragic 88.6% |
| Paiute | 4.6 /100 | #235 | Tragic 88.6% |
| Immigrants | Pakistan | 4.5 /100 | #236 | Tragic 88.6% |
| Immigrants | Turkey | 4.4 /100 | #237 | Tragic 88.6% |
| Immigrants | Somalia | 4.2 /100 | #238 | Tragic 88.6% |
| Kiowa | 3.8 /100 | #239 | Tragic 88.6% |
| Eastern Europeans | 3.0 /100 | #240 | Tragic 88.5% |
| Taiwanese | 2.6 /100 | #241 | Tragic 88.4% |
| Turks | 2.5 /100 | #242 | Tragic 88.4% |
| Immigrants | Belgium | 2.1 /100 | #243 | Tragic 88.4% |
| Immigrants | Portugal | 2.0 /100 | #244 | Tragic 88.3% |
| Immigrants | Czechoslovakia | 1.9 /100 | #245 | Tragic 88.3% |
Demographics Similar to Immigrants from Zimbabwe by 1 or more Vehicles in Household
In terms of 1 or more vehicles in household, the demographic groups most similar to Immigrants from Zimbabwe are Immigrants from Bahamas (90.2%, a difference of 0.0%), Sioux (90.2%, a difference of 0.0%), Bahamian (90.2%, a difference of 0.020%), Immigrants from Moldova (90.2%, a difference of 0.040%), and Immigrants from Lithuania (90.2%, a difference of 0.040%).
| Demographics | Rating | Rank | 1 or more Vehicles in Household |
| Latvians | 86.3 /100 | #137 | Excellent 90.3% |
| Syrians | 86.3 /100 | #138 | Excellent 90.3% |
| Estonians | 85.6 /100 | #139 | Excellent 90.3% |
| Sudanese | 85.2 /100 | #140 | Excellent 90.3% |
| Immigrants | Moldova | 83.1 /100 | #141 | Excellent 90.2% |
| Immigrants | Lithuania | 83.0 /100 | #142 | Excellent 90.2% |
| Immigrants | Bahamas | 81.5 /100 | #143 | Excellent 90.2% |
| Immigrants | Zimbabwe | 81.5 /100 | #144 | Excellent 90.2% |
| Sioux | 81.3 /100 | #145 | Excellent 90.2% |
| Bahamians | 80.5 /100 | #146 | Excellent 90.2% |
| Chileans | 79.8 /100 | #147 | Good 90.2% |
| Immigrants | Eastern Africa | 78.2 /100 | #148 | Good 90.1% |
| Immigrants | Nicaragua | 76.7 /100 | #149 | Good 90.1% |
| Immigrants | Micronesia | 75.9 /100 | #150 | Good 90.1% |
| Immigrants | Bosnia and Herzegovina | 75.4 /100 | #151 | Good 90.1% |