Fijian vs Immigrants from Zimbabwe 1 or more Vehicles in Household
COMPARE
Fijian
Immigrants from Zimbabwe
1 or more Vehicles in Household
1 or more Vehicles in Household Comparison
Fijians
Immigrants from Zimbabwe
90.5%
1 OR MORE VEHICLES IN HOUSEHOLD
91.8/ 100
METRIC RATING
123rd/ 347
METRIC RANK
90.2%
1 OR MORE VEHICLES IN HOUSEHOLD
81.5/ 100
METRIC RATING
144th/ 347
METRIC RANK
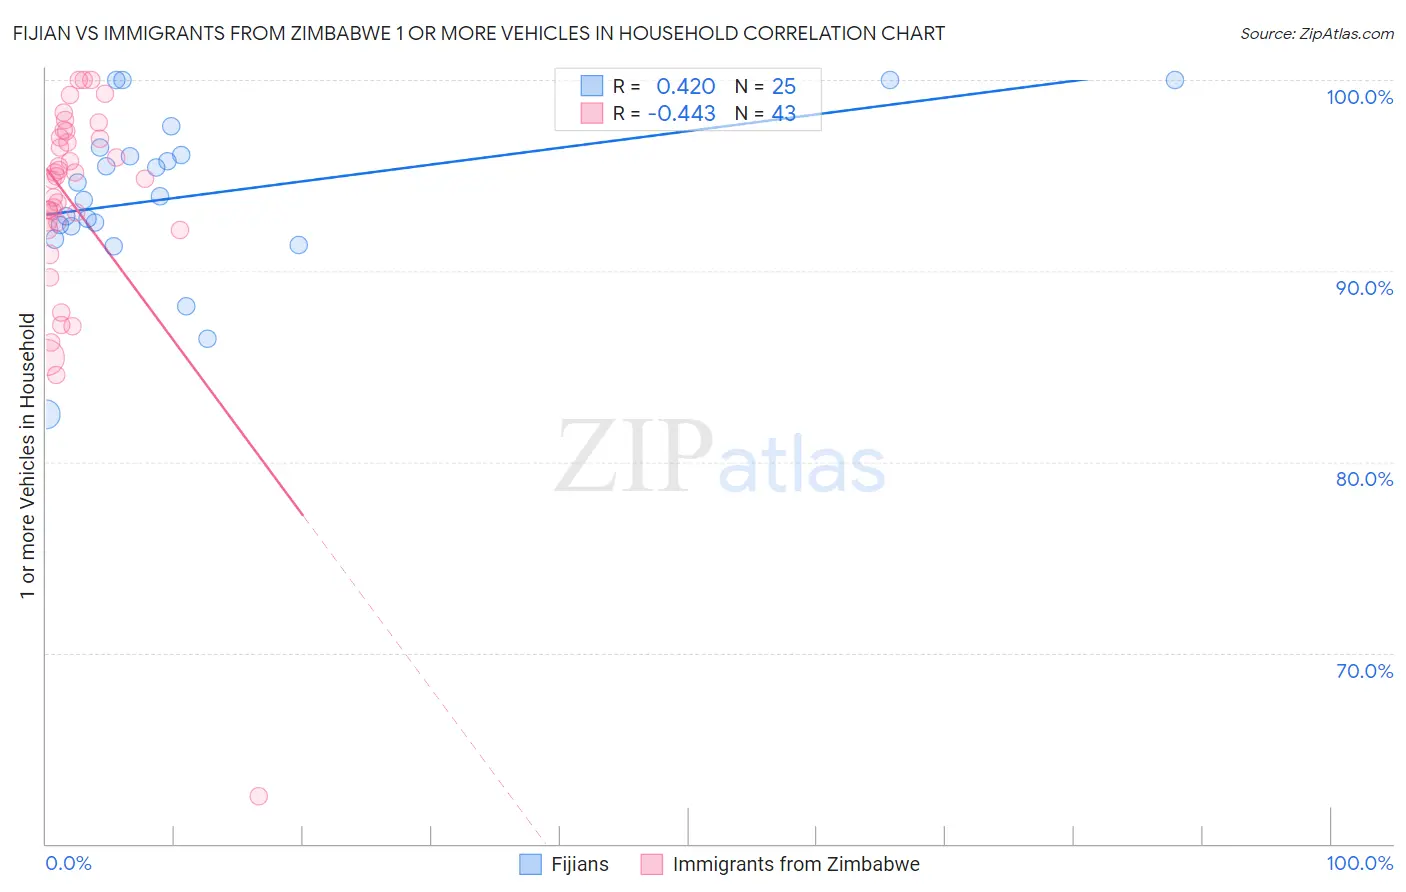
Fijian vs Immigrants from Zimbabwe 1 or more Vehicles in Household Correlation Chart
The statistical analysis conducted on geographies consisting of 55,948,040 people shows a moderate positive correlation between the proportion of Fijians and percentage of households with 1 or more vehicles available in the United States with a correlation coefficient (R) of 0.420 and weighted average of 90.5%. Similarly, the statistical analysis conducted on geographies consisting of 117,752,092 people shows a moderate negative correlation between the proportion of Immigrants from Zimbabwe and percentage of households with 1 or more vehicles available in the United States with a correlation coefficient (R) of -0.443 and weighted average of 90.2%, a difference of 0.36%.
1 or more Vehicles in Household Correlation Summary
| Measurement | Fijian | Immigrants from Zimbabwe |
| Minimum | 82.5% | 62.5% |
| Maximum | 100.0% | 100.0% |
| Range | 17.5% | 37.5% |
| Mean | 94.0% | 93.4% |
| Median | 93.9% | 94.9% |
| Interquartile 25% (IQ1) | 92.0% | 92.2% |
| Interquartile 75% (IQ3) | 96.2% | 97.0% |
| Interquartile Range (IQR) | 4.2% | 4.8% |
| Standard Deviation (Sample) | 4.2% | 6.3% |
| Standard Deviation (Population) | 4.2% | 6.2% |
Similar Demographics by 1 or more Vehicles in Household
Demographics Similar to Fijians by 1 or more Vehicles in Household
In terms of 1 or more vehicles in household, the demographic groups most similar to Fijians are Icelander (90.5%, a difference of 0.010%), Costa Rican (90.5%, a difference of 0.010%), Immigrants from Thailand (90.6%, a difference of 0.020%), Puget Sound Salish (90.5%, a difference of 0.020%), and Blackfeet (90.6%, a difference of 0.040%).
| Demographics | Rating | Rank | 1 or more Vehicles in Household |
| Chippewa | 94.3 /100 | #116 | Exceptional 90.7% |
| Greeks | 93.5 /100 | #117 | Exceptional 90.6% |
| Japanese | 93.4 /100 | #118 | Exceptional 90.6% |
| Blackfeet | 92.6 /100 | #119 | Exceptional 90.6% |
| Immigrants | Thailand | 92.3 /100 | #120 | Exceptional 90.6% |
| Icelanders | 92.1 /100 | #121 | Exceptional 90.5% |
| Costa Ricans | 92.0 /100 | #122 | Exceptional 90.5% |
| Fijians | 91.8 /100 | #123 | Exceptional 90.5% |
| Puget Sound Salish | 91.5 /100 | #124 | Exceptional 90.5% |
| Immigrants | Korea | 90.5 /100 | #125 | Exceptional 90.5% |
| Immigrants | Cameroon | 89.4 /100 | #126 | Excellent 90.4% |
| Immigrants | Azores | 89.1 /100 | #127 | Excellent 90.4% |
| Burmese | 89.0 /100 | #128 | Excellent 90.4% |
| Marshallese | 88.9 /100 | #129 | Excellent 90.4% |
| Nicaraguans | 88.8 /100 | #130 | Excellent 90.4% |
Demographics Similar to Immigrants from Zimbabwe by 1 or more Vehicles in Household
In terms of 1 or more vehicles in household, the demographic groups most similar to Immigrants from Zimbabwe are Immigrants from Bahamas (90.2%, a difference of 0.0%), Sioux (90.2%, a difference of 0.0%), Bahamian (90.2%, a difference of 0.020%), Immigrants from Moldova (90.2%, a difference of 0.040%), and Immigrants from Lithuania (90.2%, a difference of 0.040%).
| Demographics | Rating | Rank | 1 or more Vehicles in Household |
| Latvians | 86.3 /100 | #137 | Excellent 90.3% |
| Syrians | 86.3 /100 | #138 | Excellent 90.3% |
| Estonians | 85.6 /100 | #139 | Excellent 90.3% |
| Sudanese | 85.2 /100 | #140 | Excellent 90.3% |
| Immigrants | Moldova | 83.1 /100 | #141 | Excellent 90.2% |
| Immigrants | Lithuania | 83.0 /100 | #142 | Excellent 90.2% |
| Immigrants | Bahamas | 81.5 /100 | #143 | Excellent 90.2% |
| Immigrants | Zimbabwe | 81.5 /100 | #144 | Excellent 90.2% |
| Sioux | 81.3 /100 | #145 | Excellent 90.2% |
| Bahamians | 80.5 /100 | #146 | Excellent 90.2% |
| Chileans | 79.8 /100 | #147 | Good 90.2% |
| Immigrants | Eastern Africa | 78.2 /100 | #148 | Good 90.1% |
| Immigrants | Nicaragua | 76.7 /100 | #149 | Good 90.1% |
| Immigrants | Micronesia | 75.9 /100 | #150 | Good 90.1% |
| Immigrants | Bosnia and Herzegovina | 75.4 /100 | #151 | Good 90.1% |