Immigrants from Somalia vs Assyrian/Chaldean/Syriac 1 or more Vehicles in Household
COMPARE
Immigrants from Somalia
Assyrian/Chaldean/Syriac
1 or more Vehicles in Household
1 or more Vehicles in Household Comparison
Immigrants from Somalia
Assyrians/Chaldeans/Syriacs
88.6%
1 OR MORE VEHICLES IN HOUSEHOLD
4.2/ 100
METRIC RATING
238th/ 347
METRIC RANK
93.0%
1 OR MORE VEHICLES IN HOUSEHOLD
100.0/ 100
METRIC RATING
16th/ 347
METRIC RANK
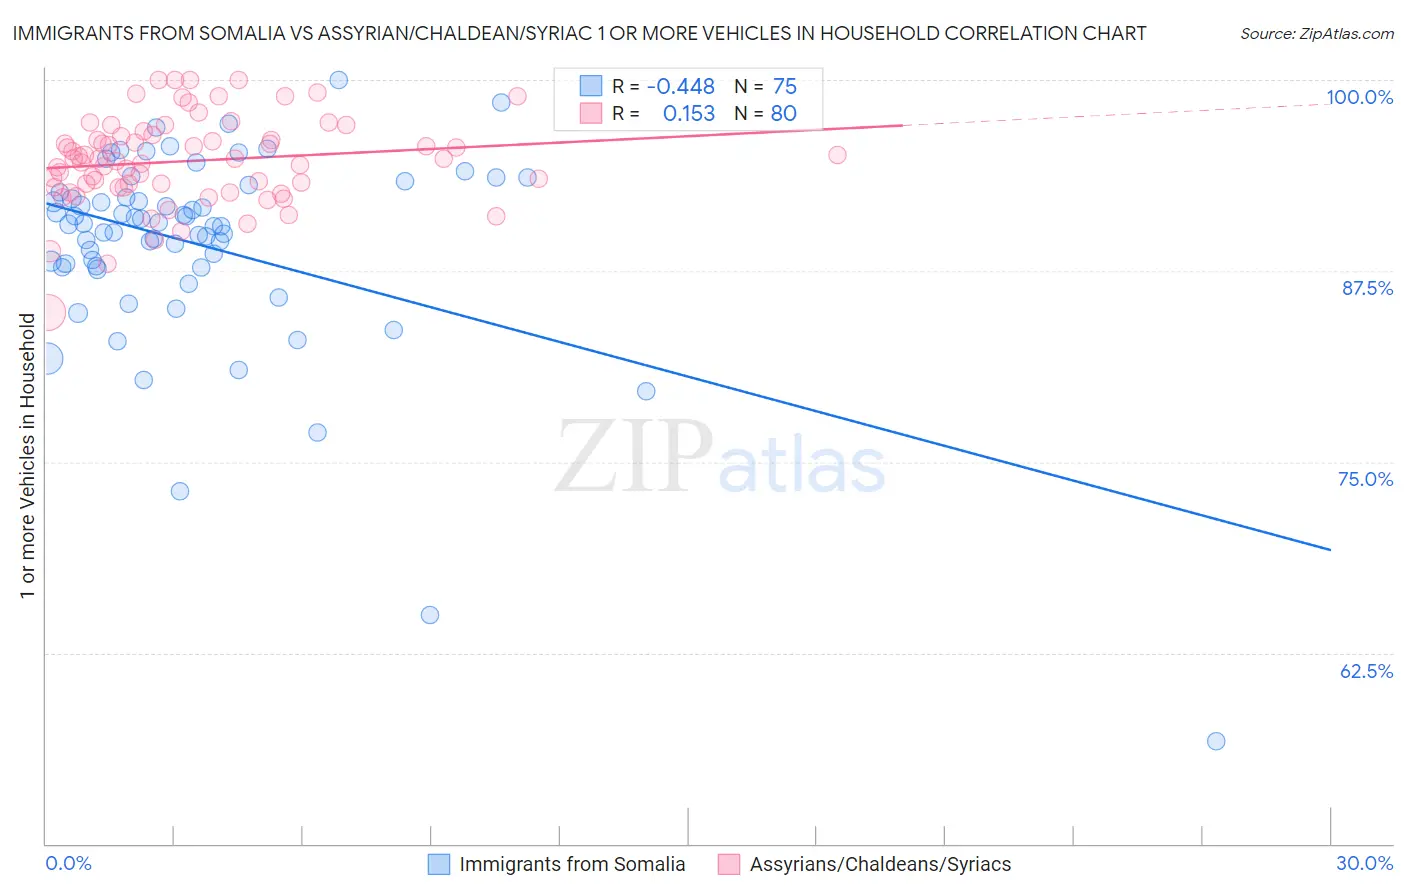
Immigrants from Somalia vs Assyrian/Chaldean/Syriac 1 or more Vehicles in Household Correlation Chart
The statistical analysis conducted on geographies consisting of 92,102,978 people shows a moderate negative correlation between the proportion of Immigrants from Somalia and percentage of households with 1 or more vehicles available in the United States with a correlation coefficient (R) of -0.448 and weighted average of 88.6%. Similarly, the statistical analysis conducted on geographies consisting of 110,295,152 people shows a poor positive correlation between the proportion of Assyrians/Chaldeans/Syriacs and percentage of households with 1 or more vehicles available in the United States with a correlation coefficient (R) of 0.153 and weighted average of 93.0%, a difference of 5.0%.
1 or more Vehicles in Household Correlation Summary
| Measurement | Immigrants from Somalia | Assyrian/Chaldean/Syriac |
| Minimum | 56.7% | 84.7% |
| Maximum | 100.0% | 100.0% |
| Range | 43.3% | 15.3% |
| Mean | 89.2% | 94.7% |
| Median | 90.5% | 94.8% |
| Interquartile 25% (IQ1) | 87.7% | 93.0% |
| Interquartile 75% (IQ3) | 92.6% | 96.4% |
| Interquartile Range (IQR) | 4.9% | 3.4% |
| Standard Deviation (Sample) | 6.8% | 2.9% |
| Standard Deviation (Population) | 6.7% | 2.9% |
Similar Demographics by 1 or more Vehicles in Household
Demographics Similar to Immigrants from Somalia by 1 or more Vehicles in Household
In terms of 1 or more vehicles in household, the demographic groups most similar to Immigrants from Somalia are Immigrants from Turkey (88.6%, a difference of 0.020%), Immigrants from Pakistan (88.6%, a difference of 0.030%), Paiute (88.6%, a difference of 0.040%), Kiowa (88.6%, a difference of 0.040%), and Immigrants from Peru (88.6%, a difference of 0.050%).
| Demographics | Rating | Rank | 1 or more Vehicles in Household |
| Russians | 5.0 /100 | #231 | Tragic 88.7% |
| Immigrants | Japan | 4.9 /100 | #232 | Tragic 88.7% |
| Houma | 4.8 /100 | #233 | Tragic 88.6% |
| Immigrants | Peru | 4.7 /100 | #234 | Tragic 88.6% |
| Paiute | 4.6 /100 | #235 | Tragic 88.6% |
| Immigrants | Pakistan | 4.5 /100 | #236 | Tragic 88.6% |
| Immigrants | Turkey | 4.4 /100 | #237 | Tragic 88.6% |
| Immigrants | Somalia | 4.2 /100 | #238 | Tragic 88.6% |
| Kiowa | 3.8 /100 | #239 | Tragic 88.6% |
| Eastern Europeans | 3.0 /100 | #240 | Tragic 88.5% |
| Taiwanese | 2.6 /100 | #241 | Tragic 88.4% |
| Turks | 2.5 /100 | #242 | Tragic 88.4% |
| Immigrants | Belgium | 2.1 /100 | #243 | Tragic 88.4% |
| Immigrants | Portugal | 2.0 /100 | #244 | Tragic 88.3% |
| Immigrants | Czechoslovakia | 1.9 /100 | #245 | Tragic 88.3% |
Demographics Similar to Assyrians/Chaldeans/Syriacs by 1 or more Vehicles in Household
In terms of 1 or more vehicles in household, the demographic groups most similar to Assyrians/Chaldeans/Syriacs are Mexican (93.0%, a difference of 0.0%), Irish (93.1%, a difference of 0.020%), European (93.0%, a difference of 0.030%), White/Caucasian (93.1%, a difference of 0.060%), and Welsh (93.0%, a difference of 0.060%).
| Demographics | Rating | Rank | 1 or more Vehicles in Household |
| Scotch-Irish | 100.0 /100 | #9 | Exceptional 93.3% |
| Dutch | 100.0 /100 | #10 | Exceptional 93.3% |
| Czechs | 100.0 /100 | #11 | Exceptional 93.3% |
| Scandinavians | 100.0 /100 | #12 | Exceptional 93.1% |
| Whites/Caucasians | 100.0 /100 | #13 | Exceptional 93.1% |
| Irish | 100.0 /100 | #14 | Exceptional 93.1% |
| Mexicans | 100.0 /100 | #15 | Exceptional 93.0% |
| Assyrians/Chaldeans/Syriacs | 100.0 /100 | #16 | Exceptional 93.0% |
| Europeans | 100.0 /100 | #17 | Exceptional 93.0% |
| Welsh | 100.0 /100 | #18 | Exceptional 93.0% |
| Tongans | 100.0 /100 | #19 | Exceptional 92.9% |
| Arapaho | 100.0 /100 | #20 | Exceptional 92.7% |
| Ottawa | 100.0 /100 | #21 | Exceptional 92.7% |
| French | 100.0 /100 | #22 | Exceptional 92.7% |
| Nepalese | 100.0 /100 | #23 | Exceptional 92.6% |