Immigrants from Somalia vs Cypriot 1 or more Vehicles in Household
COMPARE
Immigrants from Somalia
Cypriot
1 or more Vehicles in Household
1 or more Vehicles in Household Comparison
Immigrants from Somalia
Cypriots
88.6%
1 OR MORE VEHICLES IN HOUSEHOLD
4.2/ 100
METRIC RATING
238th/ 347
METRIC RANK
84.4%
1 OR MORE VEHICLES IN HOUSEHOLD
0.0/ 100
METRIC RATING
315th/ 347
METRIC RANK
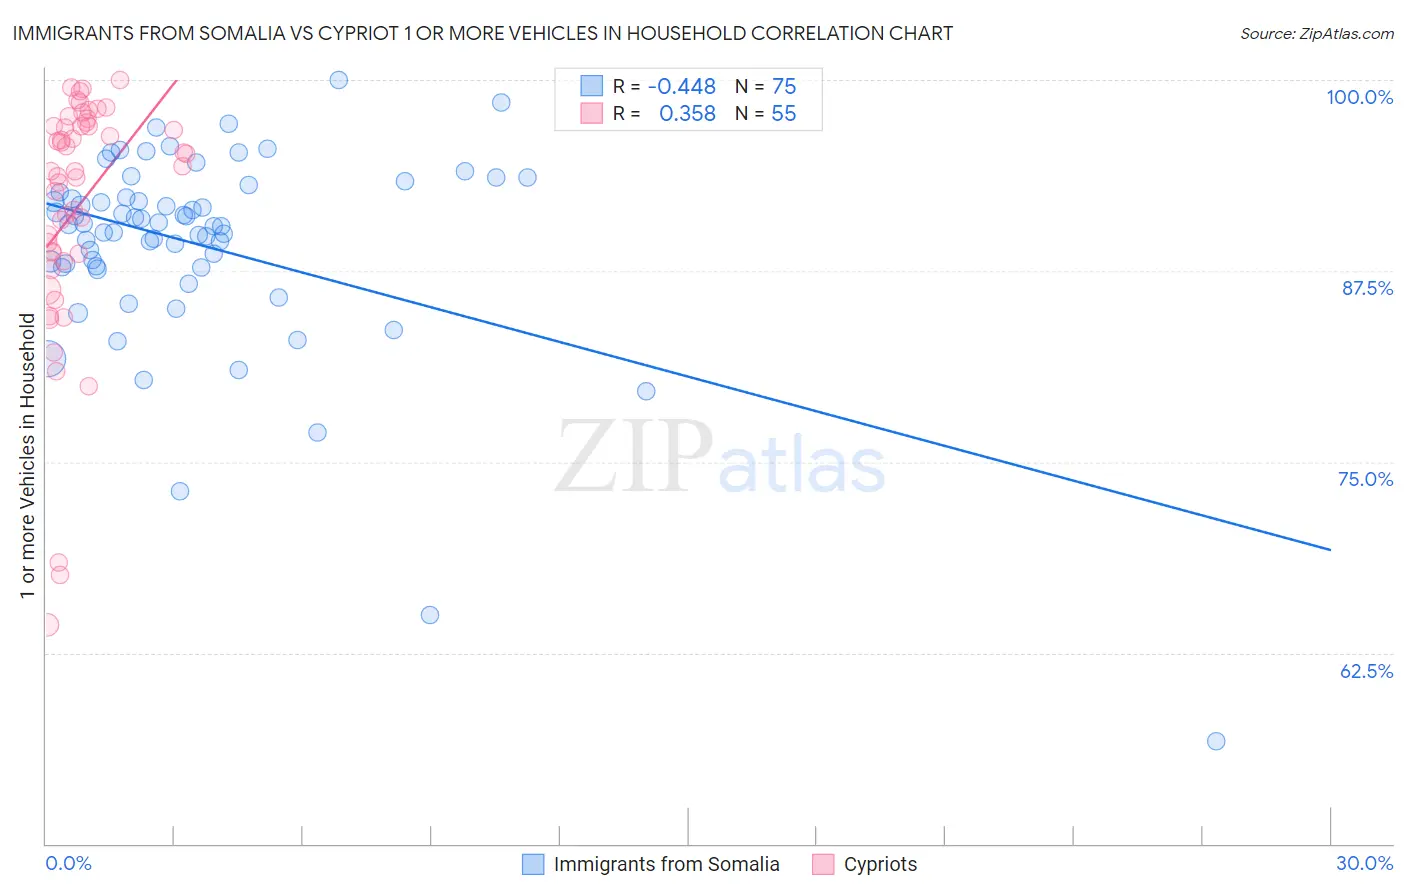
Immigrants from Somalia vs Cypriot 1 or more Vehicles in Household Correlation Chart
The statistical analysis conducted on geographies consisting of 92,102,978 people shows a moderate negative correlation between the proportion of Immigrants from Somalia and percentage of households with 1 or more vehicles available in the United States with a correlation coefficient (R) of -0.448 and weighted average of 88.6%. Similarly, the statistical analysis conducted on geographies consisting of 61,854,678 people shows a mild positive correlation between the proportion of Cypriots and percentage of households with 1 or more vehicles available in the United States with a correlation coefficient (R) of 0.358 and weighted average of 84.4%, a difference of 5.0%.
1 or more Vehicles in Household Correlation Summary
| Measurement | Immigrants from Somalia | Cypriot |
| Minimum | 56.7% | 64.3% |
| Maximum | 100.0% | 100.0% |
| Range | 43.3% | 35.7% |
| Mean | 89.2% | 91.6% |
| Median | 90.5% | 94.0% |
| Interquartile 25% (IQ1) | 87.7% | 88.6% |
| Interquartile 75% (IQ3) | 92.6% | 97.0% |
| Interquartile Range (IQR) | 4.9% | 8.4% |
| Standard Deviation (Sample) | 6.8% | 8.0% |
| Standard Deviation (Population) | 6.7% | 7.9% |
Similar Demographics by 1 or more Vehicles in Household
Demographics Similar to Immigrants from Somalia by 1 or more Vehicles in Household
In terms of 1 or more vehicles in household, the demographic groups most similar to Immigrants from Somalia are Immigrants from Turkey (88.6%, a difference of 0.020%), Immigrants from Pakistan (88.6%, a difference of 0.030%), Paiute (88.6%, a difference of 0.040%), Kiowa (88.6%, a difference of 0.040%), and Immigrants from Peru (88.6%, a difference of 0.050%).
| Demographics | Rating | Rank | 1 or more Vehicles in Household |
| Russians | 5.0 /100 | #231 | Tragic 88.7% |
| Immigrants | Japan | 4.9 /100 | #232 | Tragic 88.7% |
| Houma | 4.8 /100 | #233 | Tragic 88.6% |
| Immigrants | Peru | 4.7 /100 | #234 | Tragic 88.6% |
| Paiute | 4.6 /100 | #235 | Tragic 88.6% |
| Immigrants | Pakistan | 4.5 /100 | #236 | Tragic 88.6% |
| Immigrants | Turkey | 4.4 /100 | #237 | Tragic 88.6% |
| Immigrants | Somalia | 4.2 /100 | #238 | Tragic 88.6% |
| Kiowa | 3.8 /100 | #239 | Tragic 88.6% |
| Eastern Europeans | 3.0 /100 | #240 | Tragic 88.5% |
| Taiwanese | 2.6 /100 | #241 | Tragic 88.4% |
| Turks | 2.5 /100 | #242 | Tragic 88.4% |
| Immigrants | Belgium | 2.1 /100 | #243 | Tragic 88.4% |
| Immigrants | Portugal | 2.0 /100 | #244 | Tragic 88.3% |
| Immigrants | Czechoslovakia | 1.9 /100 | #245 | Tragic 88.3% |
Demographics Similar to Cypriots by 1 or more Vehicles in Household
In terms of 1 or more vehicles in household, the demographic groups most similar to Cypriots are Albanian (84.4%, a difference of 0.070%), Immigrants from Israel (84.5%, a difference of 0.13%), Cape Verdean (84.5%, a difference of 0.16%), Puerto Rican (84.6%, a difference of 0.27%), and U.S. Virgin Islander (84.6%, a difference of 0.30%).
| Demographics | Rating | Rank | 1 or more Vehicles in Household |
| Immigrants | Belize | 0.0 /100 | #308 | Tragic 84.7% |
| Immigrants | Haiti | 0.0 /100 | #309 | Tragic 84.7% |
| U.S. Virgin Islanders | 0.0 /100 | #310 | Tragic 84.6% |
| Puerto Ricans | 0.0 /100 | #311 | Tragic 84.6% |
| Cape Verdeans | 0.0 /100 | #312 | Tragic 84.5% |
| Immigrants | Israel | 0.0 /100 | #313 | Tragic 84.5% |
| Albanians | 0.0 /100 | #314 | Tragic 84.4% |
| Cypriots | 0.0 /100 | #315 | Tragic 84.4% |
| Alaska Natives | 0.0 /100 | #316 | Tragic 83.8% |
| Ghanaians | 0.0 /100 | #317 | Tragic 83.6% |
| Immigrants | Ghana | 0.0 /100 | #318 | Tragic 83.4% |
| Immigrants | Belarus | 0.0 /100 | #319 | Tragic 83.3% |
| Soviet Union | 0.0 /100 | #320 | Tragic 82.7% |
| Jamaicans | 0.0 /100 | #321 | Tragic 82.1% |
| Immigrants | Cabo Verde | 0.0 /100 | #322 | Tragic 81.6% |