Immigrants from Somalia vs Assyrian/Chaldean/Syriac 4th Grade
COMPARE
Immigrants from Somalia
Assyrian/Chaldean/Syriac
4th Grade
4th Grade Comparison
Immigrants from Somalia
Assyrians/Chaldeans/Syriacs
96.5%
4TH GRADE
0.0/ 100
METRIC RATING
297th/ 347
METRIC RANK
97.2%
4TH GRADE
3.0/ 100
METRIC RATING
234th/ 347
METRIC RANK
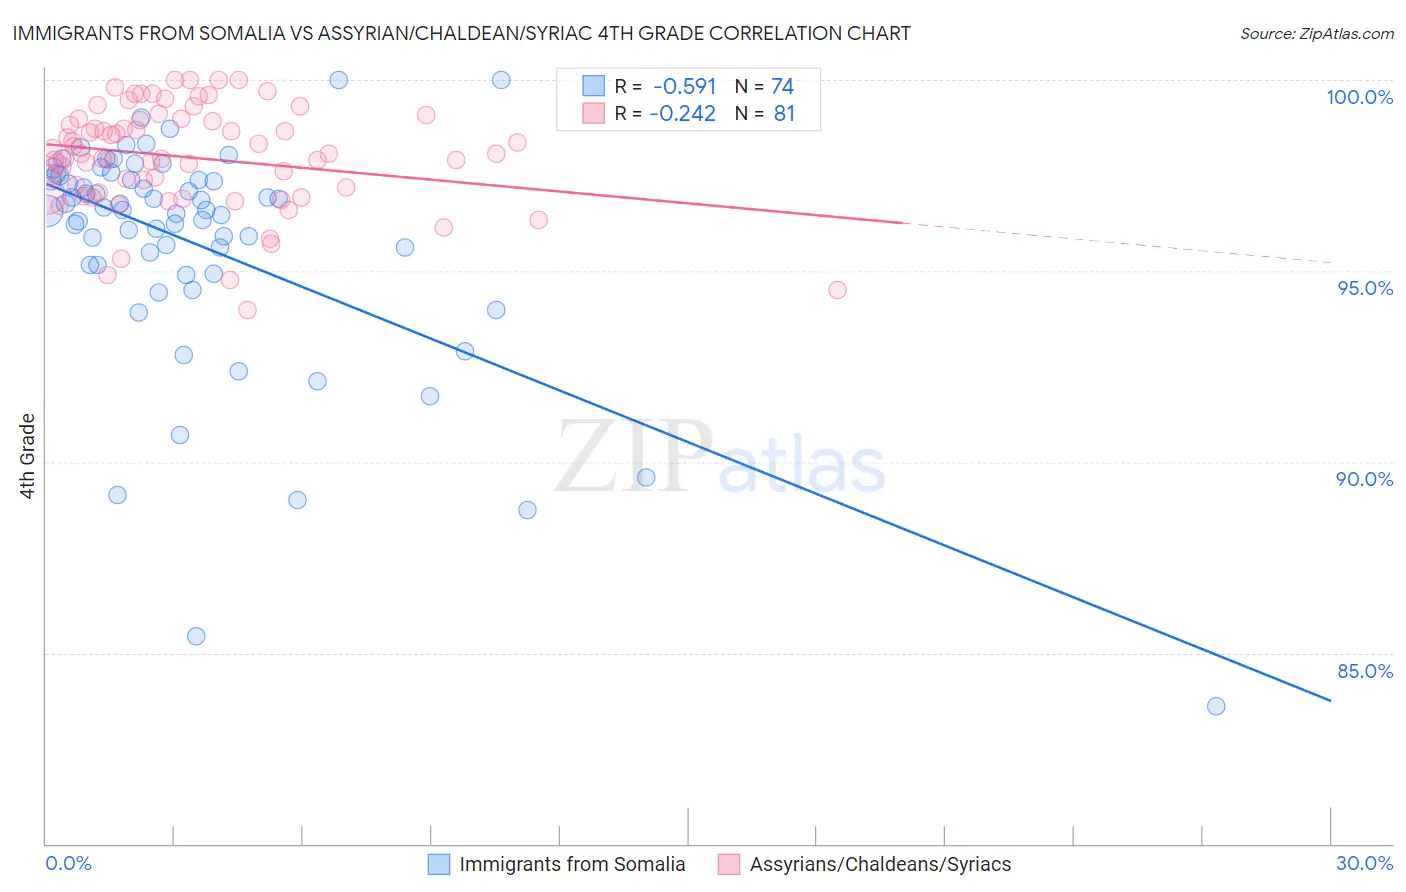
Immigrants from Somalia vs Assyrian/Chaldean/Syriac 4th Grade Correlation Chart
The statistical analysis conducted on geographies consisting of 92,108,376 people shows a substantial negative correlation between the proportion of Immigrants from Somalia and percentage of population with at least 4th grade education in the United States with a correlation coefficient (R) of -0.591 and weighted average of 96.5%. Similarly, the statistical analysis conducted on geographies consisting of 110,318,304 people shows a weak negative correlation between the proportion of Assyrians/Chaldeans/Syriacs and percentage of population with at least 4th grade education in the United States with a correlation coefficient (R) of -0.242 and weighted average of 97.2%, a difference of 0.67%.
4th Grade Correlation Summary
| Measurement | Immigrants from Somalia | Assyrian/Chaldean/Syriac |
| Minimum | 83.6% | 94.0% |
| Maximum | 100.0% | 100.0% |
| Range | 16.4% | 6.0% |
| Mean | 95.7% | 98.0% |
| Median | 96.6% | 98.1% |
| Interquartile 25% (IQ1) | 95.2% | 97.0% |
| Interquartile 75% (IQ3) | 97.4% | 99.0% |
| Interquartile Range (IQR) | 2.2% | 2.0% |
| Standard Deviation (Sample) | 3.1% | 1.4% |
| Standard Deviation (Population) | 3.0% | 1.3% |
Similar Demographics by 4th Grade
Demographics Similar to Immigrants from Somalia by 4th Grade
In terms of 4th grade, the demographic groups most similar to Immigrants from Somalia are Haitian (96.5%, a difference of 0.020%), Immigrants from Dominica (96.5%, a difference of 0.030%), Immigrants from South Eastern Asia (96.5%, a difference of 0.040%), Immigrants (96.5%, a difference of 0.080%), and Somali (96.6%, a difference of 0.090%).
| Demographics | Rating | Rank | 4th Grade |
| British West Indians | 0.0 /100 | #290 | Tragic 96.7% |
| Immigrants | Grenada | 0.0 /100 | #291 | Tragic 96.7% |
| Malaysians | 0.0 /100 | #292 | Tragic 96.7% |
| Puerto Ricans | 0.0 /100 | #293 | Tragic 96.7% |
| Immigrants | Eritrea | 0.0 /100 | #294 | Tragic 96.7% |
| Immigrants | Portugal | 0.0 /100 | #295 | Tragic 96.6% |
| Somalis | 0.0 /100 | #296 | Tragic 96.6% |
| Immigrants | Somalia | 0.0 /100 | #297 | Tragic 96.5% |
| Haitians | 0.0 /100 | #298 | Tragic 96.5% |
| Immigrants | Dominica | 0.0 /100 | #299 | Tragic 96.5% |
| Immigrants | South Eastern Asia | 0.0 /100 | #300 | Tragic 96.5% |
| Immigrants | Immigrants | 0.0 /100 | #301 | Tragic 96.5% |
| Immigrants | Cuba | 0.0 /100 | #302 | Tragic 96.4% |
| Guyanese | 0.0 /100 | #303 | Tragic 96.4% |
| Ecuadorians | 0.0 /100 | #304 | Tragic 96.4% |
Demographics Similar to Assyrians/Chaldeans/Syriacs by 4th Grade
In terms of 4th grade, the demographic groups most similar to Assyrians/Chaldeans/Syriacs are Senegalese (97.2%, a difference of 0.0%), Yuman (97.2%, a difference of 0.0%), Immigrants from Malaysia (97.2%, a difference of 0.010%), Immigrants from Western Asia (97.2%, a difference of 0.010%), and Immigrants from Eastern Asia (97.2%, a difference of 0.010%).
| Demographics | Rating | Rank | 4th Grade |
| Immigrants | Pakistan | 3.7 /100 | #227 | Tragic 97.2% |
| Sub-Saharan Africans | 3.6 /100 | #228 | Tragic 97.2% |
| Liberians | 3.6 /100 | #229 | Tragic 97.2% |
| Uruguayans | 3.5 /100 | #230 | Tragic 97.2% |
| Immigrants | Malaysia | 3.4 /100 | #231 | Tragic 97.2% |
| Immigrants | Western Asia | 3.4 /100 | #232 | Tragic 97.2% |
| Senegalese | 3.1 /100 | #233 | Tragic 97.2% |
| Assyrians/Chaldeans/Syriacs | 3.0 /100 | #234 | Tragic 97.2% |
| Yuman | 2.9 /100 | #235 | Tragic 97.2% |
| Immigrants | Eastern Asia | 2.7 /100 | #236 | Tragic 97.2% |
| Immigrants | Costa Rica | 2.0 /100 | #237 | Tragic 97.2% |
| Indians (Asian) | 1.9 /100 | #238 | Tragic 97.2% |
| Nigerians | 1.8 /100 | #239 | Tragic 97.1% |
| Colombians | 1.6 /100 | #240 | Tragic 97.1% |
| Immigrants | Indonesia | 1.5 /100 | #241 | Tragic 97.1% |