Jamaican vs Assyrian/Chaldean/Syriac 1 or more Vehicles in Household
COMPARE
Jamaican
Assyrian/Chaldean/Syriac
1 or more Vehicles in Household
1 or more Vehicles in Household Comparison
Jamaicans
Assyrians/Chaldeans/Syriacs
82.1%
1 OR MORE VEHICLES IN HOUSEHOLD
0.0/ 100
METRIC RATING
321st/ 347
METRIC RANK
93.0%
1 OR MORE VEHICLES IN HOUSEHOLD
100.0/ 100
METRIC RATING
16th/ 347
METRIC RANK
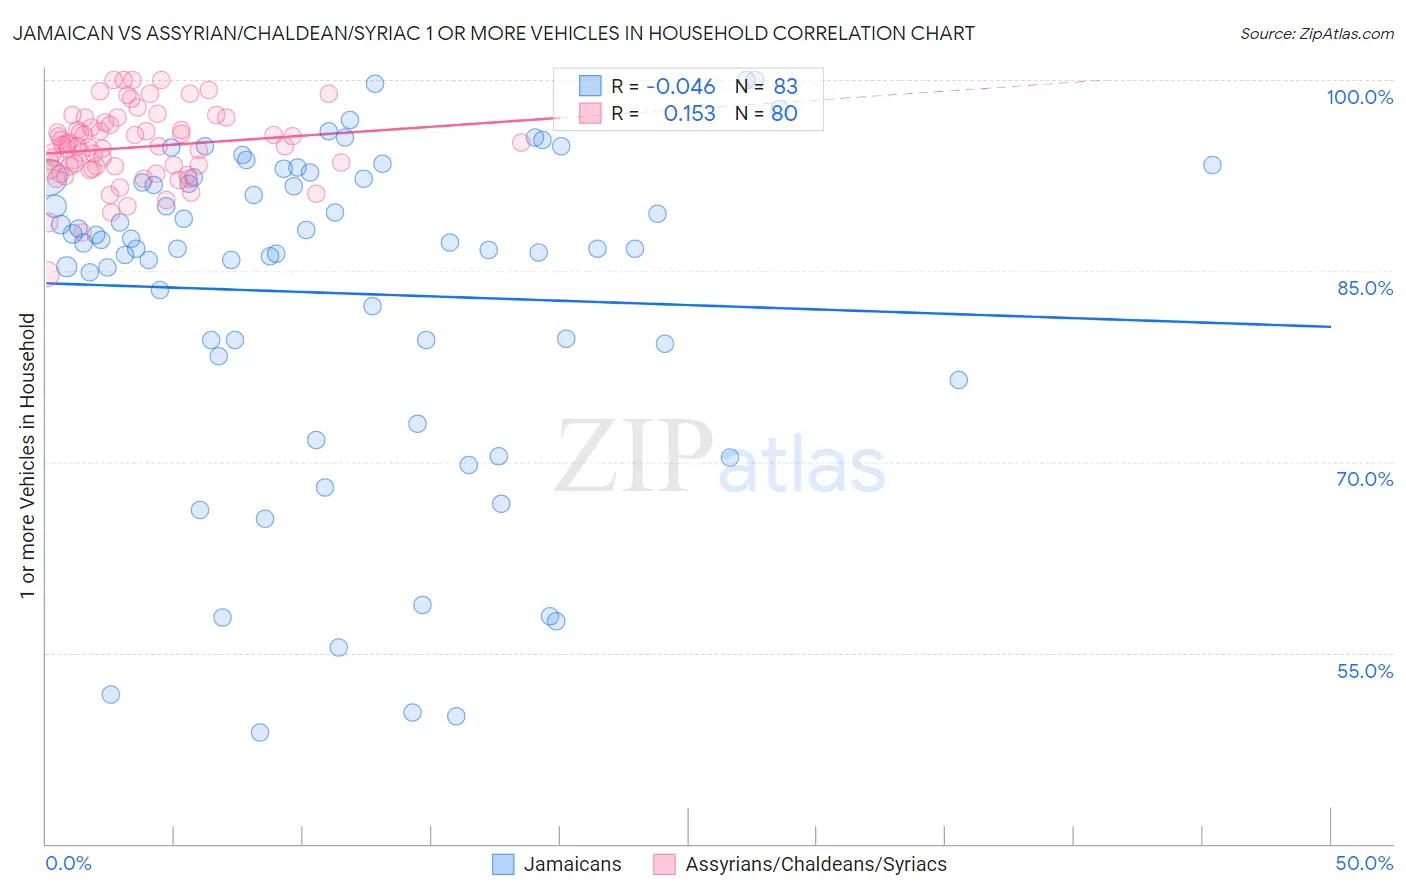
Jamaican vs Assyrian/Chaldean/Syriac 1 or more Vehicles in Household Correlation Chart
The statistical analysis conducted on geographies consisting of 367,719,271 people shows no correlation between the proportion of Jamaicans and percentage of households with 1 or more vehicles available in the United States with a correlation coefficient (R) of -0.046 and weighted average of 82.1%. Similarly, the statistical analysis conducted on geographies consisting of 110,295,152 people shows a poor positive correlation between the proportion of Assyrians/Chaldeans/Syriacs and percentage of households with 1 or more vehicles available in the United States with a correlation coefficient (R) of 0.153 and weighted average of 93.0%, a difference of 13.3%.
1 or more Vehicles in Household Correlation Summary
| Measurement | Jamaican | Assyrian/Chaldean/Syriac |
| Minimum | 48.7% | 84.7% |
| Maximum | 100.0% | 100.0% |
| Range | 51.3% | 15.3% |
| Mean | 83.3% | 94.7% |
| Median | 87.2% | 94.8% |
| Interquartile 25% (IQ1) | 79.3% | 93.0% |
| Interquartile 75% (IQ3) | 92.3% | 96.4% |
| Interquartile Range (IQR) | 13.0% | 3.4% |
| Standard Deviation (Sample) | 13.0% | 2.9% |
| Standard Deviation (Population) | 12.9% | 2.9% |
Similar Demographics by 1 or more Vehicles in Household
Demographics Similar to Jamaicans by 1 or more Vehicles in Household
In terms of 1 or more vehicles in household, the demographic groups most similar to Jamaicans are Soviet Union (82.7%, a difference of 0.64%), Immigrants from Cabo Verde (81.6%, a difference of 0.67%), Immigrants from Belarus (83.3%, a difference of 1.5%), Immigrants from Ghana (83.4%, a difference of 1.6%), and Ghanaian (83.6%, a difference of 1.8%).
| Demographics | Rating | Rank | 1 or more Vehicles in Household |
| Albanians | 0.0 /100 | #314 | Tragic 84.4% |
| Cypriots | 0.0 /100 | #315 | Tragic 84.4% |
| Alaska Natives | 0.0 /100 | #316 | Tragic 83.8% |
| Ghanaians | 0.0 /100 | #317 | Tragic 83.6% |
| Immigrants | Ghana | 0.0 /100 | #318 | Tragic 83.4% |
| Immigrants | Belarus | 0.0 /100 | #319 | Tragic 83.3% |
| Soviet Union | 0.0 /100 | #320 | Tragic 82.7% |
| Jamaicans | 0.0 /100 | #321 | Tragic 82.1% |
| Immigrants | Cabo Verde | 0.0 /100 | #322 | Tragic 81.6% |
| Immigrants | Yemen | 0.0 /100 | #323 | Tragic 80.5% |
| Immigrants | Caribbean | 0.0 /100 | #324 | Tragic 80.4% |
| Senegalese | 0.0 /100 | #325 | Tragic 80.4% |
| Immigrants | West Indies | 0.0 /100 | #326 | Tragic 79.5% |
| Immigrants | Senegal | 0.0 /100 | #327 | Tragic 79.0% |
| Ecuadorians | 0.0 /100 | #328 | Tragic 77.9% |
Demographics Similar to Assyrians/Chaldeans/Syriacs by 1 or more Vehicles in Household
In terms of 1 or more vehicles in household, the demographic groups most similar to Assyrians/Chaldeans/Syriacs are Mexican (93.0%, a difference of 0.0%), Irish (93.1%, a difference of 0.020%), European (93.0%, a difference of 0.030%), White/Caucasian (93.1%, a difference of 0.060%), and Welsh (93.0%, a difference of 0.060%).
| Demographics | Rating | Rank | 1 or more Vehicles in Household |
| Scotch-Irish | 100.0 /100 | #9 | Exceptional 93.3% |
| Dutch | 100.0 /100 | #10 | Exceptional 93.3% |
| Czechs | 100.0 /100 | #11 | Exceptional 93.3% |
| Scandinavians | 100.0 /100 | #12 | Exceptional 93.1% |
| Whites/Caucasians | 100.0 /100 | #13 | Exceptional 93.1% |
| Irish | 100.0 /100 | #14 | Exceptional 93.1% |
| Mexicans | 100.0 /100 | #15 | Exceptional 93.0% |
| Assyrians/Chaldeans/Syriacs | 100.0 /100 | #16 | Exceptional 93.0% |
| Europeans | 100.0 /100 | #17 | Exceptional 93.0% |
| Welsh | 100.0 /100 | #18 | Exceptional 93.0% |
| Tongans | 100.0 /100 | #19 | Exceptional 92.9% |
| Arapaho | 100.0 /100 | #20 | Exceptional 92.7% |
| Ottawa | 100.0 /100 | #21 | Exceptional 92.7% |
| French | 100.0 /100 | #22 | Exceptional 92.7% |
| Nepalese | 100.0 /100 | #23 | Exceptional 92.6% |