Italian vs Assyrian/Chaldean/Syriac 1 or more Vehicles in Household
COMPARE
Italian
Assyrian/Chaldean/Syriac
1 or more Vehicles in Household
1 or more Vehicles in Household Comparison
Italians
Assyrians/Chaldeans/Syriacs
92.3%
1 OR MORE VEHICLES IN HOUSEHOLD
99.9/ 100
METRIC RATING
34th/ 347
METRIC RANK
93.0%
1 OR MORE VEHICLES IN HOUSEHOLD
100.0/ 100
METRIC RATING
16th/ 347
METRIC RANK
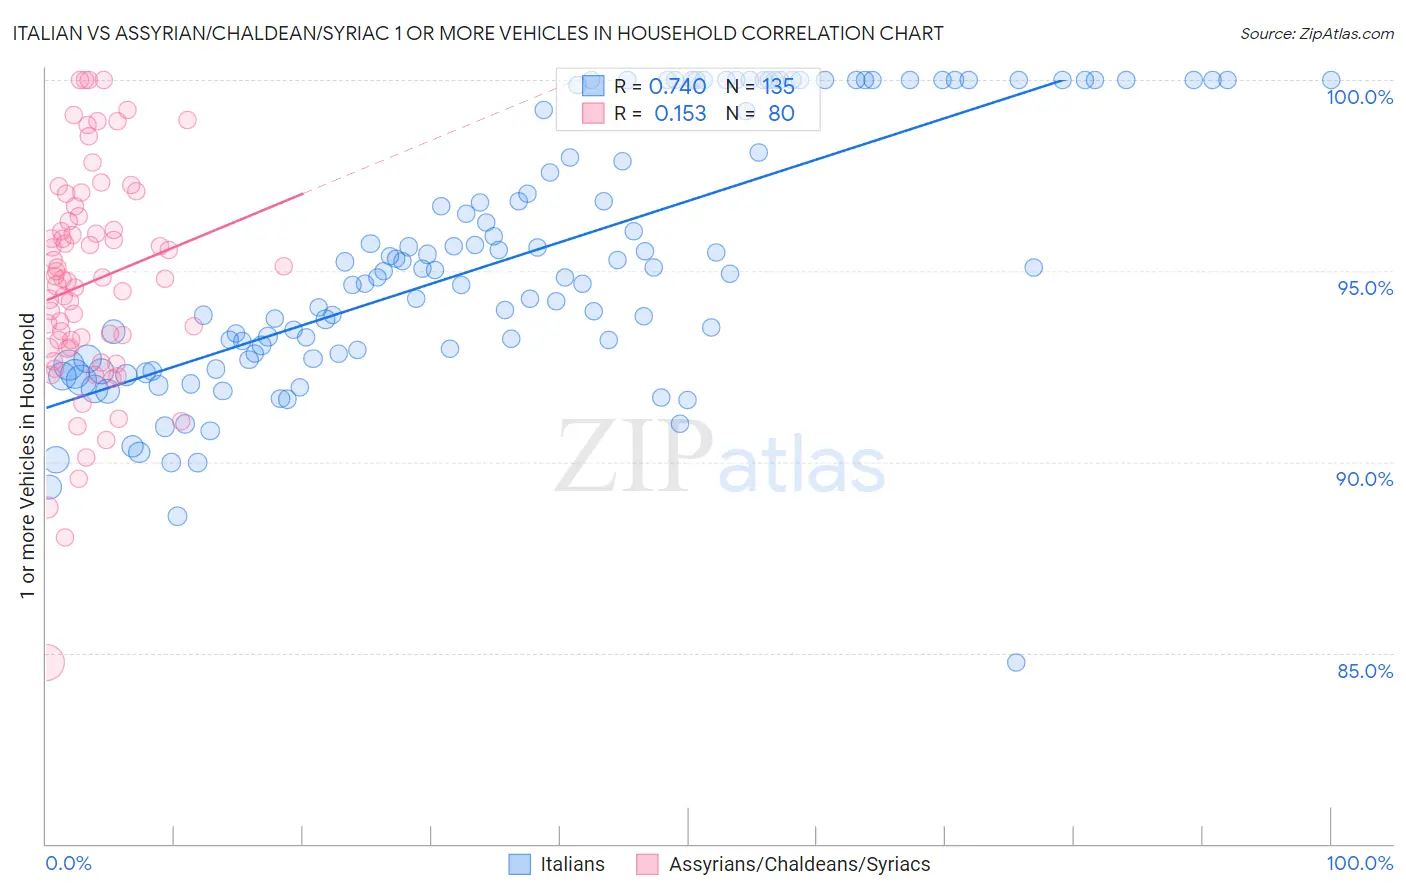
Italian vs Assyrian/Chaldean/Syriac 1 or more Vehicles in Household Correlation Chart
The statistical analysis conducted on geographies consisting of 548,442,279 people shows a strong positive correlation between the proportion of Italians and percentage of households with 1 or more vehicles available in the United States with a correlation coefficient (R) of 0.740 and weighted average of 92.3%. Similarly, the statistical analysis conducted on geographies consisting of 110,295,152 people shows a poor positive correlation between the proportion of Assyrians/Chaldeans/Syriacs and percentage of households with 1 or more vehicles available in the United States with a correlation coefficient (R) of 0.153 and weighted average of 93.0%, a difference of 0.77%.
1 or more Vehicles in Household Correlation Summary
| Measurement | Italian | Assyrian/Chaldean/Syriac |
| Minimum | 84.8% | 84.7% |
| Maximum | 100.0% | 100.0% |
| Range | 15.2% | 15.3% |
| Mean | 95.3% | 94.7% |
| Median | 95.0% | 94.8% |
| Interquartile 25% (IQ1) | 92.7% | 93.0% |
| Interquartile 75% (IQ3) | 99.9% | 96.4% |
| Interquartile Range (IQR) | 7.2% | 3.4% |
| Standard Deviation (Sample) | 3.4% | 2.9% |
| Standard Deviation (Population) | 3.4% | 2.9% |
Demographics Similar to Italians and Assyrians/Chaldeans/Syriacs by 1 or more Vehicles in Household
In terms of 1 or more vehicles in household, the demographic groups most similar to Italians are Czechoslovakian (92.3%, a difference of 0.010%), Cherokee (92.4%, a difference of 0.070%), Basque (92.4%, a difference of 0.080%), Samoan (92.4%, a difference of 0.12%), and Native Hawaiian (92.4%, a difference of 0.13%). Similarly, the demographic groups most similar to Assyrians/Chaldeans/Syriacs are Mexican (93.0%, a difference of 0.0%), European (93.0%, a difference of 0.030%), Welsh (93.0%, a difference of 0.060%), Tongan (92.9%, a difference of 0.18%), and Arapaho (92.7%, a difference of 0.34%).
| Demographics | Rating | Rank | 1 or more Vehicles in Household |
| Mexicans | 100.0 /100 | #15 | Exceptional 93.0% |
| Assyrians/Chaldeans/Syriacs | 100.0 /100 | #16 | Exceptional 93.0% |
| Europeans | 100.0 /100 | #17 | Exceptional 93.0% |
| Welsh | 100.0 /100 | #18 | Exceptional 93.0% |
| Tongans | 100.0 /100 | #19 | Exceptional 92.9% |
| Arapaho | 100.0 /100 | #20 | Exceptional 92.7% |
| Ottawa | 100.0 /100 | #21 | Exceptional 92.7% |
| French | 100.0 /100 | #22 | Exceptional 92.7% |
| Nepalese | 100.0 /100 | #23 | Exceptional 92.6% |
| Yaqui | 100.0 /100 | #24 | Exceptional 92.6% |
| Immigrants | Iraq | 100.0 /100 | #25 | Exceptional 92.5% |
| British | 100.0 /100 | #26 | Exceptional 92.5% |
| Americans | 100.0 /100 | #27 | Exceptional 92.5% |
| Sri Lankans | 100.0 /100 | #28 | Exceptional 92.5% |
| Native Hawaiians | 100.0 /100 | #29 | Exceptional 92.4% |
| Finns | 100.0 /100 | #30 | Exceptional 92.4% |
| Samoans | 100.0 /100 | #31 | Exceptional 92.4% |
| Basques | 100.0 /100 | #32 | Exceptional 92.4% |
| Cherokee | 100.0 /100 | #33 | Exceptional 92.4% |
| Italians | 99.9 /100 | #34 | Exceptional 92.3% |
| Czechoslovakians | 99.9 /100 | #35 | Exceptional 92.3% |