German vs Creek 4 or more Vehicles in Household
COMPARE
German
Creek
4 or more Vehicles in Household
4 or more Vehicles in Household Comparison
Germans
Creek
7.5%
4 OR MORE VEHICLES IN HOUSEHOLD
99.9/ 100
METRIC RATING
69th/ 347
METRIC RANK
7.2%
4 OR MORE VEHICLES IN HOUSEHOLD
99.6/ 100
METRIC RATING
90th/ 347
METRIC RANK
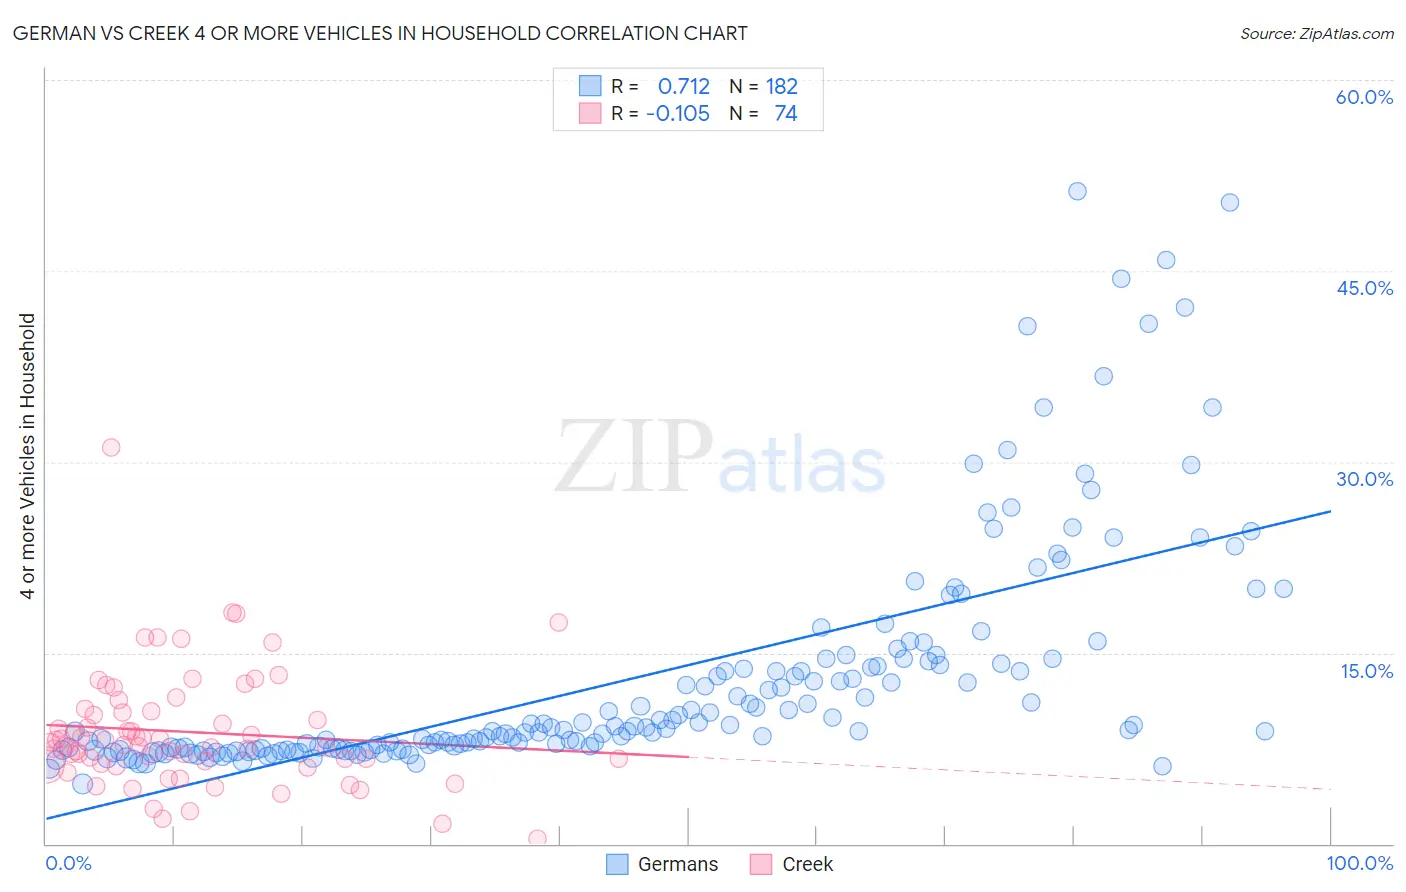
German vs Creek 4 or more Vehicles in Household Correlation Chart
The statistical analysis conducted on geographies consisting of 576,875,838 people shows a strong positive correlation between the proportion of Germans and percentage of households with 4 or more vehicles available in the United States with a correlation coefficient (R) of 0.712 and weighted average of 7.5%. Similarly, the statistical analysis conducted on geographies consisting of 178,228,664 people shows a poor negative correlation between the proportion of Creek and percentage of households with 4 or more vehicles available in the United States with a correlation coefficient (R) of -0.105 and weighted average of 7.2%, a difference of 3.6%.
4 or more Vehicles in Household Correlation Summary
| Measurement | German | Creek |
| Minimum | 4.7% | 0.43% |
| Maximum | 51.2% | 31.1% |
| Range | 46.6% | 30.7% |
| Mean | 13.0% | 8.8% |
| Median | 9.0% | 7.9% |
| Interquartile 25% (IQ1) | 7.5% | 6.3% |
| Interquartile 75% (IQ3) | 14.1% | 10.4% |
| Interquartile Range (IQR) | 6.6% | 4.2% |
| Standard Deviation (Sample) | 9.1% | 4.7% |
| Standard Deviation (Population) | 9.0% | 4.6% |
Similar Demographics by 4 or more Vehicles in Household
Demographics Similar to Germans by 4 or more Vehicles in Household
In terms of 4 or more vehicles in household, the demographic groups most similar to Germans are Scottish (7.4%, a difference of 0.070%), Chickasaw (7.4%, a difference of 0.20%), Scotch-Irish (7.4%, a difference of 0.50%), Welsh (7.5%, a difference of 0.59%), and Portuguese (7.4%, a difference of 0.60%).
| Demographics | Rating | Rank | 4 or more Vehicles in Household |
| Chippewa | 100.0 /100 | #62 | Exceptional 7.6% |
| Immigrants | Micronesia | 100.0 /100 | #63 | Exceptional 7.6% |
| Bangladeshis | 100.0 /100 | #64 | Exceptional 7.6% |
| Immigrants | Azores | 100.0 /100 | #65 | Exceptional 7.5% |
| Immigrants | Taiwan | 99.9 /100 | #66 | Exceptional 7.5% |
| Americans | 99.9 /100 | #67 | Exceptional 7.5% |
| Welsh | 99.9 /100 | #68 | Exceptional 7.5% |
| Germans | 99.9 /100 | #69 | Exceptional 7.5% |
| Scottish | 99.9 /100 | #70 | Exceptional 7.4% |
| Chickasaw | 99.9 /100 | #71 | Exceptional 7.4% |
| Scotch-Irish | 99.9 /100 | #72 | Exceptional 7.4% |
| Portuguese | 99.9 /100 | #73 | Exceptional 7.4% |
| Icelanders | 99.9 /100 | #74 | Exceptional 7.4% |
| Immigrants | Cambodia | 99.9 /100 | #75 | Exceptional 7.4% |
| Laotians | 99.9 /100 | #76 | Exceptional 7.4% |
Demographics Similar to Creek by 4 or more Vehicles in Household
In terms of 4 or more vehicles in household, the demographic groups most similar to Creek are British (7.2%, a difference of 0.080%), Nonimmigrants (7.2%, a difference of 0.41%), Delaware (7.2%, a difference of 0.44%), Immigrants from Indonesia (7.2%, a difference of 0.50%), and Assyrian/Chaldean/Syriac (7.2%, a difference of 0.56%).
| Demographics | Rating | Rank | 4 or more Vehicles in Household |
| Potawatomi | 99.7 /100 | #83 | Exceptional 7.3% |
| Afghans | 99.7 /100 | #84 | Exceptional 7.3% |
| Cree | 99.7 /100 | #85 | Exceptional 7.2% |
| Immigrants | Indonesia | 99.6 /100 | #86 | Exceptional 7.2% |
| Delaware | 99.6 /100 | #87 | Exceptional 7.2% |
| Immigrants | Nonimmigrants | 99.6 /100 | #88 | Exceptional 7.2% |
| British | 99.6 /100 | #89 | Exceptional 7.2% |
| Creek | 99.6 /100 | #90 | Exceptional 7.2% |
| Assyrians/Chaldeans/Syriacs | 99.4 /100 | #91 | Exceptional 7.2% |
| Immigrants | Latin America | 99.4 /100 | #92 | Exceptional 7.1% |
| Immigrants | Afghanistan | 99.3 /100 | #93 | Exceptional 7.1% |
| Dutch West Indians | 99.3 /100 | #94 | Exceptional 7.1% |
| Czechoslovakians | 99.3 /100 | #95 | Exceptional 7.1% |
| Central Americans | 99.3 /100 | #96 | Exceptional 7.1% |
| Celtics | 99.1 /100 | #97 | Exceptional 7.1% |