Immigrants from Hong Kong vs Creek 4 or more Vehicles in Household
COMPARE
Immigrants from Hong Kong
Creek
4 or more Vehicles in Household
4 or more Vehicles in Household Comparison
Immigrants from Hong Kong
Creek
6.5%
4 OR MORE VEHICLES IN HOUSEHOLD
72.2/ 100
METRIC RATING
151st/ 347
METRIC RANK
7.2%
4 OR MORE VEHICLES IN HOUSEHOLD
99.6/ 100
METRIC RATING
90th/ 347
METRIC RANK
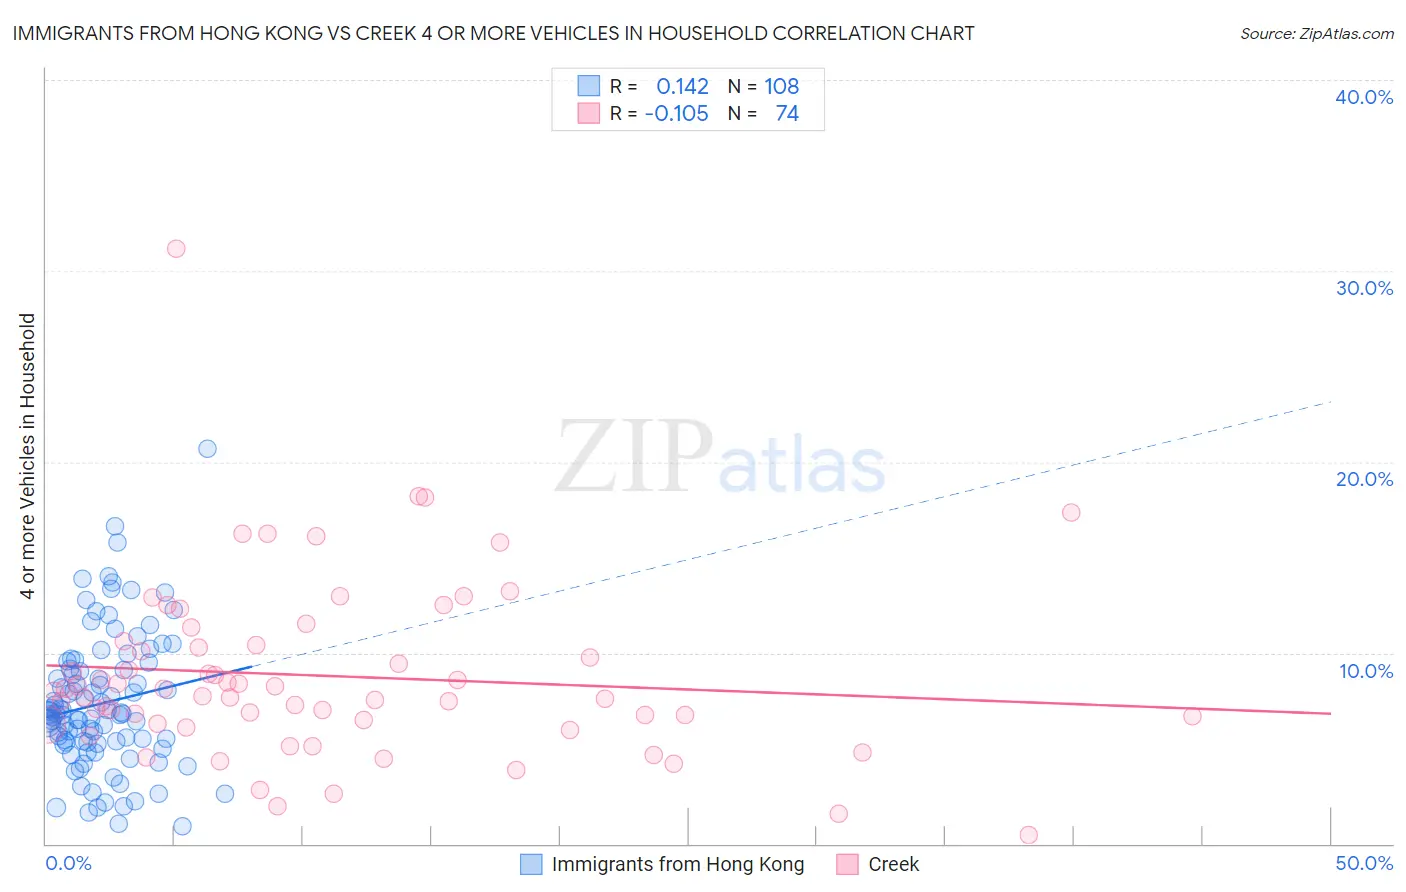
Immigrants from Hong Kong vs Creek 4 or more Vehicles in Household Correlation Chart
The statistical analysis conducted on geographies consisting of 252,698,345 people shows a poor positive correlation between the proportion of Immigrants from Hong Kong and percentage of households with 4 or more vehicles available in the United States with a correlation coefficient (R) of 0.142 and weighted average of 6.5%. Similarly, the statistical analysis conducted on geographies consisting of 178,228,664 people shows a poor negative correlation between the proportion of Creek and percentage of households with 4 or more vehicles available in the United States with a correlation coefficient (R) of -0.105 and weighted average of 7.2%, a difference of 11.0%.
4 or more Vehicles in Household Correlation Summary
| Measurement | Immigrants from Hong Kong | Creek |
| Minimum | 0.93% | 0.43% |
| Maximum | 20.7% | 31.1% |
| Range | 19.7% | 30.7% |
| Mean | 7.3% | 8.8% |
| Median | 6.8% | 7.9% |
| Interquartile 25% (IQ1) | 5.3% | 6.3% |
| Interquartile 75% (IQ3) | 9.1% | 10.4% |
| Interquartile Range (IQR) | 3.9% | 4.2% |
| Standard Deviation (Sample) | 3.5% | 4.7% |
| Standard Deviation (Population) | 3.5% | 4.6% |
Similar Demographics by 4 or more Vehicles in Household
Demographics Similar to Immigrants from Hong Kong by 4 or more Vehicles in Household
In terms of 4 or more vehicles in household, the demographic groups most similar to Immigrants from Hong Kong are Yuman (6.5%, a difference of 0.010%), Immigrants from Armenia (6.5%, a difference of 0.13%), New Zealander (6.5%, a difference of 0.14%), Central American Indian (6.5%, a difference of 0.14%), and Immigrants from Jordan (6.5%, a difference of 0.18%).
| Demographics | Rating | Rank | 4 or more Vehicles in Household |
| Immigrants | North America | 78.5 /100 | #144 | Good 6.5% |
| Croatians | 77.8 /100 | #145 | Good 6.5% |
| Immigrants | Costa Rica | 74.4 /100 | #146 | Good 6.5% |
| Immigrants | Iran | 73.9 /100 | #147 | Good 6.5% |
| Immigrants | Jordan | 73.7 /100 | #148 | Good 6.5% |
| Greeks | 73.6 /100 | #149 | Good 6.5% |
| New Zealanders | 73.3 /100 | #150 | Good 6.5% |
| Immigrants | Hong Kong | 72.2 /100 | #151 | Good 6.5% |
| Yuman | 72.1 /100 | #152 | Good 6.5% |
| Immigrants | Armenia | 71.2 /100 | #153 | Good 6.5% |
| Central American Indians | 71.1 /100 | #154 | Good 6.5% |
| Iroquois | 70.4 /100 | #155 | Good 6.5% |
| Iranians | 69.9 /100 | #156 | Good 6.5% |
| Peruvians | 69.4 /100 | #157 | Good 6.5% |
| Zimbabweans | 67.1 /100 | #158 | Good 6.4% |
Demographics Similar to Creek by 4 or more Vehicles in Household
In terms of 4 or more vehicles in household, the demographic groups most similar to Creek are British (7.2%, a difference of 0.080%), Nonimmigrants (7.2%, a difference of 0.41%), Delaware (7.2%, a difference of 0.44%), Immigrants from Indonesia (7.2%, a difference of 0.50%), and Assyrian/Chaldean/Syriac (7.2%, a difference of 0.56%).
| Demographics | Rating | Rank | 4 or more Vehicles in Household |
| Potawatomi | 99.7 /100 | #83 | Exceptional 7.3% |
| Afghans | 99.7 /100 | #84 | Exceptional 7.3% |
| Cree | 99.7 /100 | #85 | Exceptional 7.2% |
| Immigrants | Indonesia | 99.6 /100 | #86 | Exceptional 7.2% |
| Delaware | 99.6 /100 | #87 | Exceptional 7.2% |
| Immigrants | Nonimmigrants | 99.6 /100 | #88 | Exceptional 7.2% |
| British | 99.6 /100 | #89 | Exceptional 7.2% |
| Creek | 99.6 /100 | #90 | Exceptional 7.2% |
| Assyrians/Chaldeans/Syriacs | 99.4 /100 | #91 | Exceptional 7.2% |
| Immigrants | Latin America | 99.4 /100 | #92 | Exceptional 7.1% |
| Immigrants | Afghanistan | 99.3 /100 | #93 | Exceptional 7.1% |
| Dutch West Indians | 99.3 /100 | #94 | Exceptional 7.1% |
| Czechoslovakians | 99.3 /100 | #95 | Exceptional 7.1% |
| Central Americans | 99.3 /100 | #96 | Exceptional 7.1% |
| Celtics | 99.1 /100 | #97 | Exceptional 7.1% |