Immigrants from Senegal vs Welsh 10th Grade
COMPARE
Immigrants from Senegal
Welsh
10th Grade
10th Grade Comparison
Immigrants from Senegal
Welsh
92.8%
10TH GRADE
1.4/ 100
METRIC RATING
249th/ 347
METRIC RANK
95.5%
10TH GRADE
100.0/ 100
METRIC RATING
26th/ 347
METRIC RANK
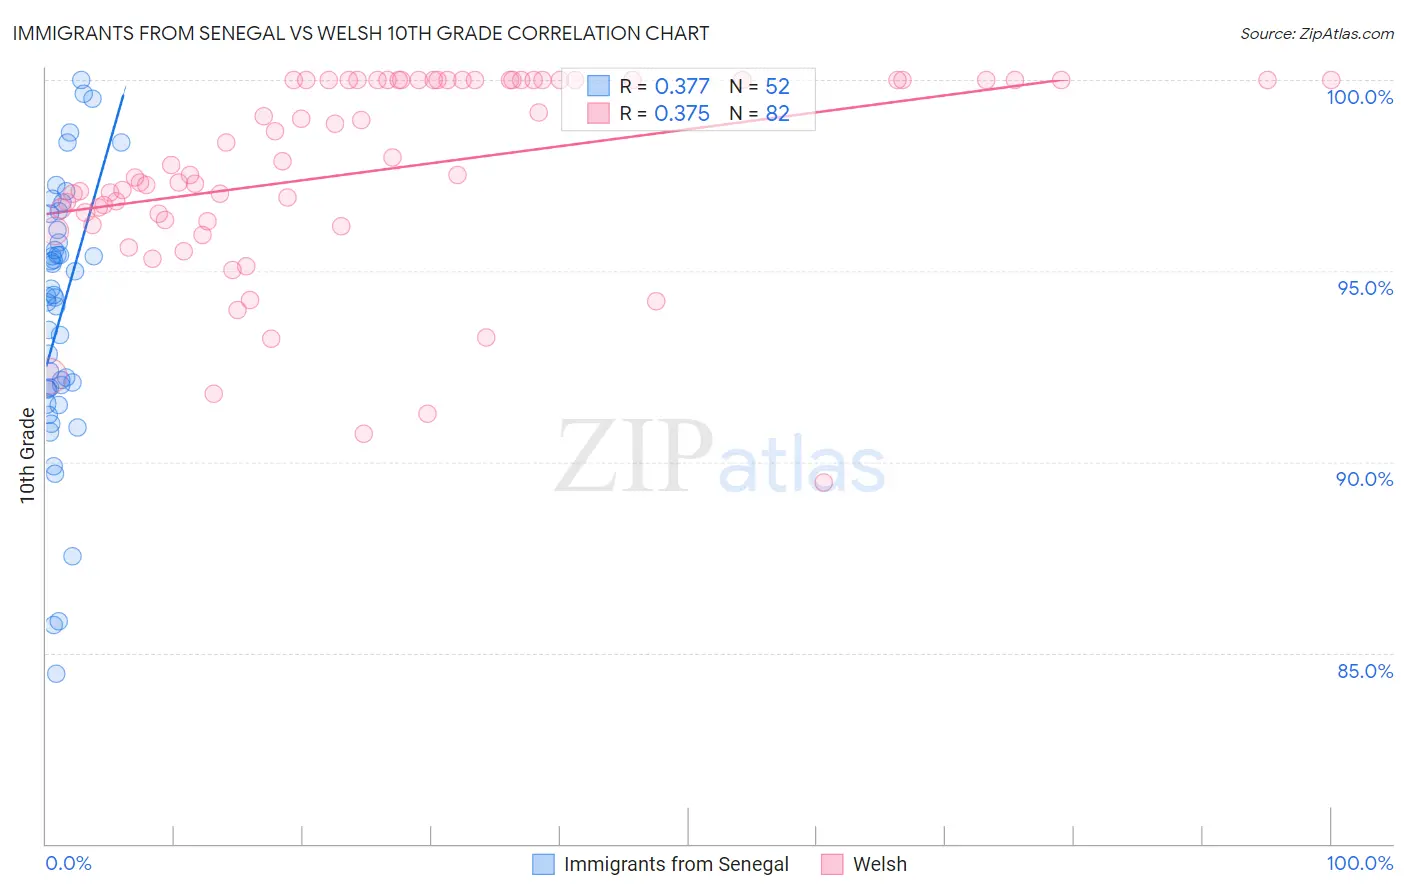
Immigrants from Senegal vs Welsh 10th Grade Correlation Chart
The statistical analysis conducted on geographies consisting of 90,130,297 people shows a mild positive correlation between the proportion of Immigrants from Senegal and percentage of population with at least 10th grade education in the United States with a correlation coefficient (R) of 0.377 and weighted average of 92.8%. Similarly, the statistical analysis conducted on geographies consisting of 528,594,177 people shows a mild positive correlation between the proportion of Welsh and percentage of population with at least 10th grade education in the United States with a correlation coefficient (R) of 0.375 and weighted average of 95.5%, a difference of 2.8%.
10th Grade Correlation Summary
| Measurement | Immigrants from Senegal | Welsh |
| Minimum | 84.4% | 89.5% |
| Maximum | 100.0% | 100.0% |
| Range | 15.6% | 10.5% |
| Mean | 93.8% | 97.6% |
| Median | 94.3% | 97.6% |
| Interquartile 25% (IQ1) | 91.9% | 96.3% |
| Interquartile 75% (IQ3) | 95.9% | 100.0% |
| Interquartile Range (IQR) | 4.0% | 3.7% |
| Standard Deviation (Sample) | 3.5% | 2.6% |
| Standard Deviation (Population) | 3.4% | 2.5% |
Similar Demographics by 10th Grade
Demographics Similar to Immigrants from Senegal by 10th Grade
In terms of 10th grade, the demographic groups most similar to Immigrants from Senegal are Immigrants from Afghanistan (92.8%, a difference of 0.010%), Colombian (92.8%, a difference of 0.010%), Jamaican (92.8%, a difference of 0.020%), Immigrants from Middle Africa (92.9%, a difference of 0.050%), and Uruguayan (92.9%, a difference of 0.070%).
| Demographics | Rating | Rank | 10th Grade |
| Immigrants | Cameroon | 2.6 /100 | #242 | Tragic 93.0% |
| Senegalese | 2.4 /100 | #243 | Tragic 93.0% |
| Spanish Americans | 2.1 /100 | #244 | Tragic 92.9% |
| Uruguayans | 1.8 /100 | #245 | Tragic 92.9% |
| Immigrants | Middle Africa | 1.7 /100 | #246 | Tragic 92.9% |
| Immigrants | Afghanistan | 1.4 /100 | #247 | Tragic 92.8% |
| Colombians | 1.4 /100 | #248 | Tragic 92.8% |
| Immigrants | Senegal | 1.4 /100 | #249 | Tragic 92.8% |
| Jamaicans | 1.2 /100 | #250 | Tragic 92.8% |
| Immigrants | Thailand | 1.0 /100 | #251 | Tragic 92.8% |
| South Americans | 0.9 /100 | #252 | Tragic 92.8% |
| Ghanaians | 0.9 /100 | #253 | Tragic 92.8% |
| Armenians | 0.9 /100 | #254 | Tragic 92.7% |
| Immigrants | Bolivia | 0.7 /100 | #255 | Tragic 92.7% |
| Immigrants | Nigeria | 0.7 /100 | #256 | Tragic 92.7% |
Demographics Similar to Welsh by 10th Grade
In terms of 10th grade, the demographic groups most similar to Welsh are European (95.5%, a difference of 0.020%), Maltese (95.5%, a difference of 0.020%), Alaskan Athabascan (95.4%, a difference of 0.020%), Luxembourger (95.4%, a difference of 0.020%), and Czech (95.5%, a difference of 0.030%).
| Demographics | Rating | Rank | 10th Grade |
| Scandinavians | 100.0 /100 | #19 | Exceptional 95.6% |
| Chinese | 100.0 /100 | #20 | Exceptional 95.5% |
| Dutch | 100.0 /100 | #21 | Exceptional 95.5% |
| Eastern Europeans | 100.0 /100 | #22 | Exceptional 95.5% |
| Czechs | 100.0 /100 | #23 | Exceptional 95.5% |
| Europeans | 100.0 /100 | #24 | Exceptional 95.5% |
| Maltese | 100.0 /100 | #25 | Exceptional 95.5% |
| Welsh | 100.0 /100 | #26 | Exceptional 95.5% |
| Alaskan Athabascans | 100.0 /100 | #27 | Exceptional 95.4% |
| Luxembourgers | 100.0 /100 | #28 | Exceptional 95.4% |
| Bulgarians | 100.0 /100 | #29 | Exceptional 95.4% |
| Belgians | 100.0 /100 | #30 | Exceptional 95.4% |
| Iranians | 100.0 /100 | #31 | Exceptional 95.3% |
| Hungarians | 100.0 /100 | #32 | Exceptional 95.3% |
| French | 100.0 /100 | #33 | Exceptional 95.3% |