Immigrants from Russia vs Spaniard Male Unemployment
COMPARE
Immigrants from Russia
Spaniard
Male Unemployment
Male Unemployment Comparison
Immigrants from Russia
Spaniards
5.3%
MALE UNEMPLOYMENT
50.7/ 100
METRIC RATING
173rd/ 347
METRIC RANK
5.3%
MALE UNEMPLOYMENT
35.1/ 100
METRIC RATING
184th/ 347
METRIC RANK
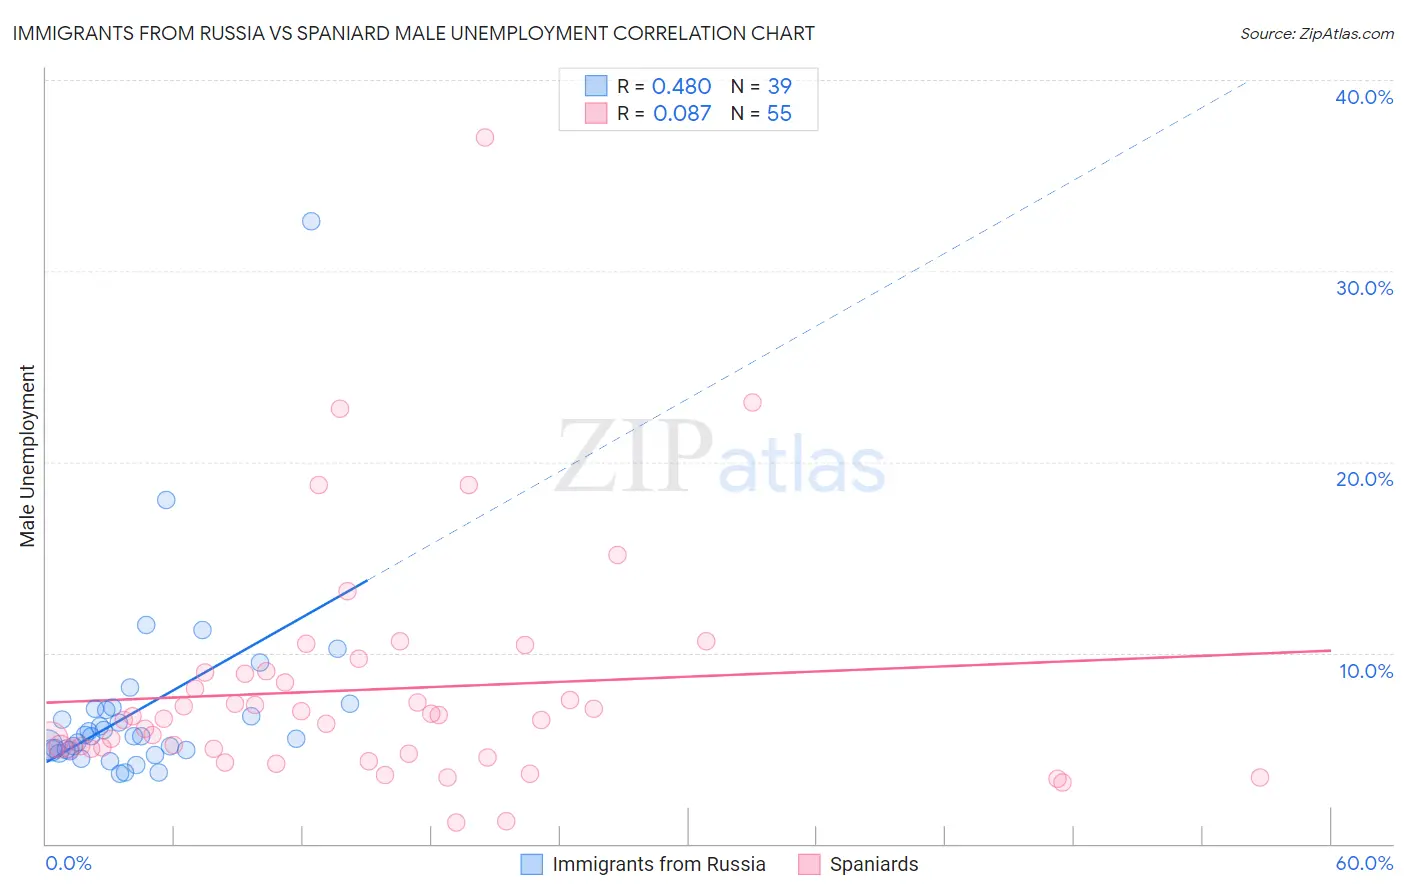
Immigrants from Russia vs Spaniard Male Unemployment Correlation Chart
The statistical analysis conducted on geographies consisting of 346,725,771 people shows a moderate positive correlation between the proportion of Immigrants from Russia and unemployment rate among males in the United States with a correlation coefficient (R) of 0.480 and weighted average of 5.3%. Similarly, the statistical analysis conducted on geographies consisting of 441,055,878 people shows a slight positive correlation between the proportion of Spaniards and unemployment rate among males in the United States with a correlation coefficient (R) of 0.087 and weighted average of 5.3%, a difference of 0.94%.
Male Unemployment Correlation Summary
| Measurement | Immigrants from Russia | Spaniard |
| Minimum | 3.7% | 1.1% |
| Maximum | 32.6% | 37.0% |
| Range | 28.9% | 35.9% |
| Mean | 7.0% | 8.1% |
| Median | 5.6% | 6.6% |
| Interquartile 25% (IQ1) | 4.9% | 5.0% |
| Interquartile 75% (IQ3) | 7.1% | 8.9% |
| Interquartile Range (IQR) | 2.2% | 4.0% |
| Standard Deviation (Sample) | 5.0% | 6.1% |
| Standard Deviation (Population) | 4.9% | 6.0% |
Demographics Similar to Immigrants from Russia and Spaniards by Male Unemployment
In terms of male unemployment, the demographic groups most similar to Immigrants from Russia are Immigrants from Kazakhstan (5.3%, a difference of 0.010%), Immigrants from Iran (5.3%, a difference of 0.040%), Peruvian (5.3%, a difference of 0.070%), Immigrants from Iraq (5.3%, a difference of 0.15%), and Immigrants from Eastern Europe (5.3%, a difference of 0.20%). Similarly, the demographic groups most similar to Spaniards are Korean (5.3%, a difference of 0.010%), Taiwanese (5.3%, a difference of 0.16%), Potawatomi (5.3%, a difference of 0.17%), Immigrants from Afghanistan (5.3%, a difference of 0.18%), and Iraqi (5.4%, a difference of 0.23%).
| Demographics | Rating | Rank | Male Unemployment |
| Immigrants | Ireland | 57.7 /100 | #168 | Average 5.3% |
| Immigrants | Congo | 57.4 /100 | #169 | Average 5.3% |
| Immigrants | Eastern Europe | 54.1 /100 | #170 | Average 5.3% |
| Peruvians | 51.9 /100 | #171 | Average 5.3% |
| Immigrants | Kazakhstan | 50.8 /100 | #172 | Average 5.3% |
| Immigrants | Russia | 50.7 /100 | #173 | Average 5.3% |
| Immigrants | Iran | 50.0 /100 | #174 | Average 5.3% |
| Immigrants | Iraq | 48.1 /100 | #175 | Average 5.3% |
| Immigrants | Poland | 46.0 /100 | #176 | Average 5.3% |
| Immigrants | Peru | 44.6 /100 | #177 | Average 5.3% |
| Osage | 42.5 /100 | #178 | Average 5.3% |
| Immigrants | Oceania | 40.8 /100 | #179 | Average 5.3% |
| Malaysians | 39.6 /100 | #180 | Fair 5.3% |
| Immigrants | Afghanistan | 37.9 /100 | #181 | Fair 5.3% |
| Potawatomi | 37.8 /100 | #182 | Fair 5.3% |
| Taiwanese | 37.6 /100 | #183 | Fair 5.3% |
| Spaniards | 35.1 /100 | #184 | Fair 5.3% |
| Koreans | 34.9 /100 | #185 | Fair 5.3% |
| Iraqis | 31.6 /100 | #186 | Fair 5.4% |
| Costa Ricans | 31.3 /100 | #187 | Fair 5.4% |
| Arabs | 30.2 /100 | #188 | Fair 5.4% |