Immigrants from Russia vs Immigrants from Sierra Leone Child Poverty Under the Age of 5
COMPARE
Immigrants from Russia
Immigrants from Sierra Leone
Child Poverty Under the Age of 5
Child Poverty Under the Age of 5 Comparison
Immigrants from Russia
Immigrants from Sierra Leone
15.0%
CHILD POVERTY UNDER THE AGE OF 5
99.3/ 100
METRIC RATING
60th/ 347
METRIC RANK
17.3%
CHILD POVERTY UNDER THE AGE OF 5
43.6/ 100
METRIC RATING
177th/ 347
METRIC RANK
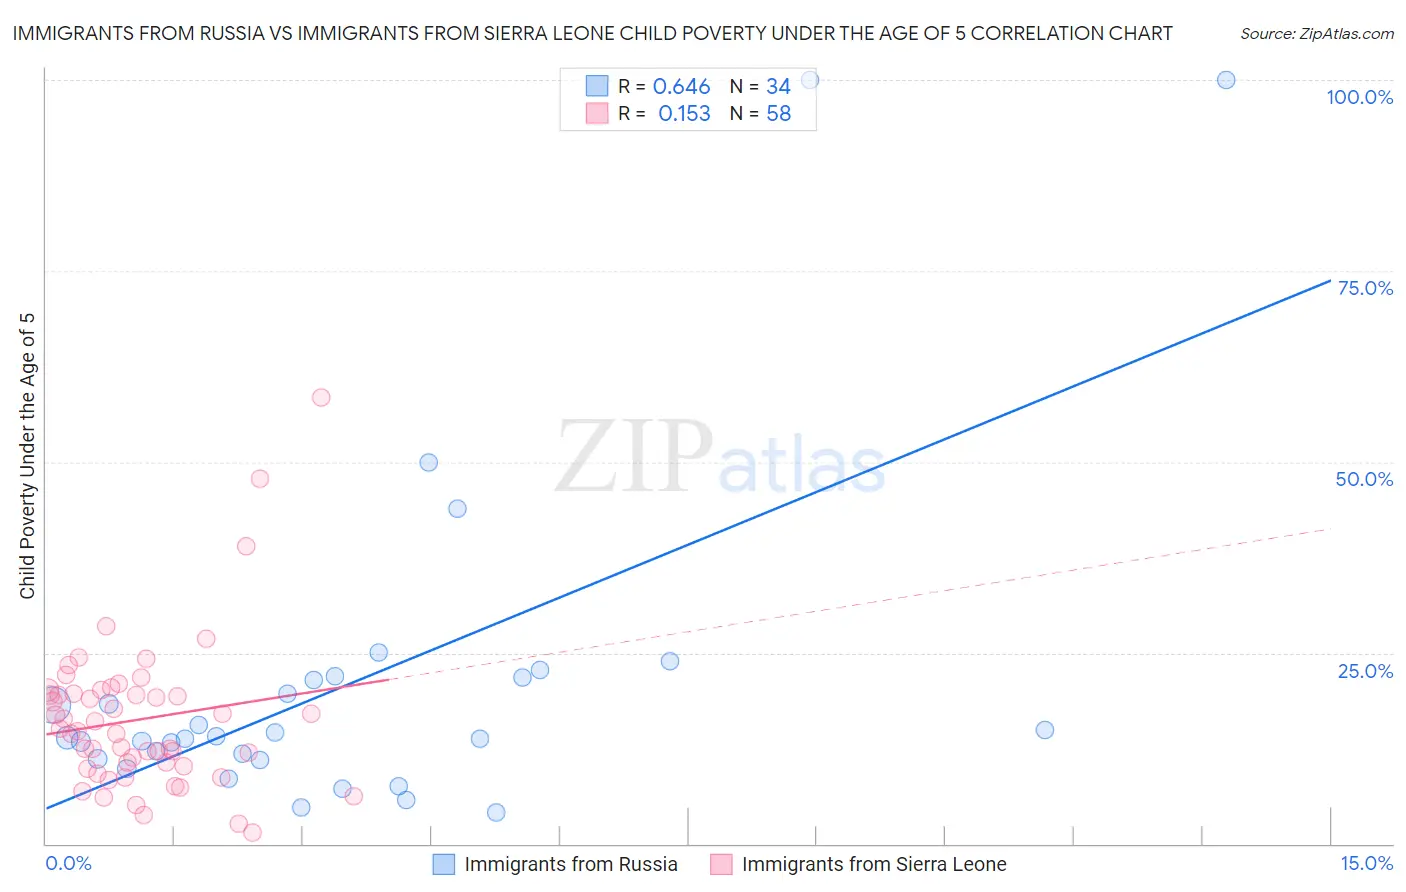
Immigrants from Russia vs Immigrants from Sierra Leone Child Poverty Under the Age of 5 Correlation Chart
The statistical analysis conducted on geographies consisting of 333,234,763 people shows a significant positive correlation between the proportion of Immigrants from Russia and poverty level among children under the age of 5 in the United States with a correlation coefficient (R) of 0.646 and weighted average of 15.0%. Similarly, the statistical analysis conducted on geographies consisting of 100,756,435 people shows a poor positive correlation between the proportion of Immigrants from Sierra Leone and poverty level among children under the age of 5 in the United States with a correlation coefficient (R) of 0.153 and weighted average of 17.3%, a difference of 15.7%.
Child Poverty Under the Age of 5 Correlation Summary
| Measurement | Immigrants from Russia | Immigrants from Sierra Leone |
| Minimum | 4.0% | 1.5% |
| Maximum | 100.0% | 58.4% |
| Range | 96.0% | 57.0% |
| Mean | 21.2% | 16.3% |
| Median | 14.0% | 14.9% |
| Interquartile 25% (IQ1) | 11.1% | 10.2% |
| Interquartile 75% (IQ3) | 21.7% | 19.7% |
| Interquartile Range (IQR) | 10.6% | 9.5% |
| Standard Deviation (Sample) | 22.1% | 9.9% |
| Standard Deviation (Population) | 21.8% | 9.8% |
Similar Demographics by Child Poverty Under the Age of 5
Demographics Similar to Immigrants from Russia by Child Poverty Under the Age of 5
In terms of child poverty under the age of 5, the demographic groups most similar to Immigrants from Russia are Paraguayan (15.0%, a difference of 0.090%), Swedish (15.0%, a difference of 0.24%), Egyptian (14.9%, a difference of 0.29%), Immigrants from Pakistan (14.9%, a difference of 0.37%), and Danish (14.9%, a difference of 0.44%).
| Demographics | Rating | Rank | Child Poverty Under the Age of 5 |
| Luxembourgers | 99.4 /100 | #53 | Exceptional 14.9% |
| Immigrants | Israel | 99.4 /100 | #54 | Exceptional 14.9% |
| Danes | 99.4 /100 | #55 | Exceptional 14.9% |
| Immigrants | Pakistan | 99.4 /100 | #56 | Exceptional 14.9% |
| Egyptians | 99.4 /100 | #57 | Exceptional 14.9% |
| Swedes | 99.4 /100 | #58 | Exceptional 15.0% |
| Paraguayans | 99.4 /100 | #59 | Exceptional 15.0% |
| Immigrants | Russia | 99.3 /100 | #60 | Exceptional 15.0% |
| Immigrants | Poland | 99.1 /100 | #61 | Exceptional 15.1% |
| Immigrants | Eastern Europe | 99.1 /100 | #62 | Exceptional 15.1% |
| Immigrants | Europe | 99.1 /100 | #63 | Exceptional 15.1% |
| Immigrants | Romania | 99.1 /100 | #64 | Exceptional 15.2% |
| Immigrants | Fiji | 99.0 /100 | #65 | Exceptional 15.2% |
| Immigrants | Scotland | 99.0 /100 | #66 | Exceptional 15.2% |
| Greeks | 99.0 /100 | #67 | Exceptional 15.2% |
Demographics Similar to Immigrants from Sierra Leone by Child Poverty Under the Age of 5
In terms of child poverty under the age of 5, the demographic groups most similar to Immigrants from Sierra Leone are Immigrants from Cameroon (17.4%, a difference of 0.10%), Immigrants from Iraq (17.3%, a difference of 0.16%), Hawaiian (17.4%, a difference of 0.23%), South American Indian (17.4%, a difference of 0.23%), and Immigrants from Germany (17.4%, a difference of 0.28%).
| Demographics | Rating | Rank | Child Poverty Under the Age of 5 |
| Immigrants | Western Asia | 59.2 /100 | #170 | Average 17.1% |
| Immigrants | Morocco | 58.9 /100 | #171 | Average 17.1% |
| Yugoslavians | 54.1 /100 | #172 | Average 17.2% |
| Welsh | 54.0 /100 | #173 | Average 17.2% |
| Immigrants | Saudi Arabia | 50.0 /100 | #174 | Average 17.2% |
| Immigrants | Lebanon | 47.6 /100 | #175 | Average 17.3% |
| Immigrants | Iraq | 45.2 /100 | #176 | Average 17.3% |
| Immigrants | Sierra Leone | 43.6 /100 | #177 | Average 17.3% |
| Immigrants | Cameroon | 42.7 /100 | #178 | Average 17.4% |
| Hawaiians | 41.5 /100 | #179 | Average 17.4% |
| South American Indians | 41.4 /100 | #180 | Average 17.4% |
| Immigrants | Germany | 41.0 /100 | #181 | Average 17.4% |
| Arabs | 40.7 /100 | #182 | Average 17.4% |
| Lebanese | 40.3 /100 | #183 | Average 17.4% |
| Immigrants | Costa Rica | 39.0 /100 | #184 | Fair 17.4% |