Central American vs Immigrants from Jamaica 3 or more Vehicles in Household
COMPARE
Central American
Immigrants from Jamaica
3 or more Vehicles in Household
3 or more Vehicles in Household Comparison
Central Americans
Immigrants from Jamaica
20.5%
3 OR MORE VEHICLES IN HOUSEHOLD
93.1/ 100
METRIC RATING
124th/ 347
METRIC RANK
14.7%
3 OR MORE VEHICLES IN HOUSEHOLD
0.0/ 100
METRIC RATING
321st/ 347
METRIC RANK
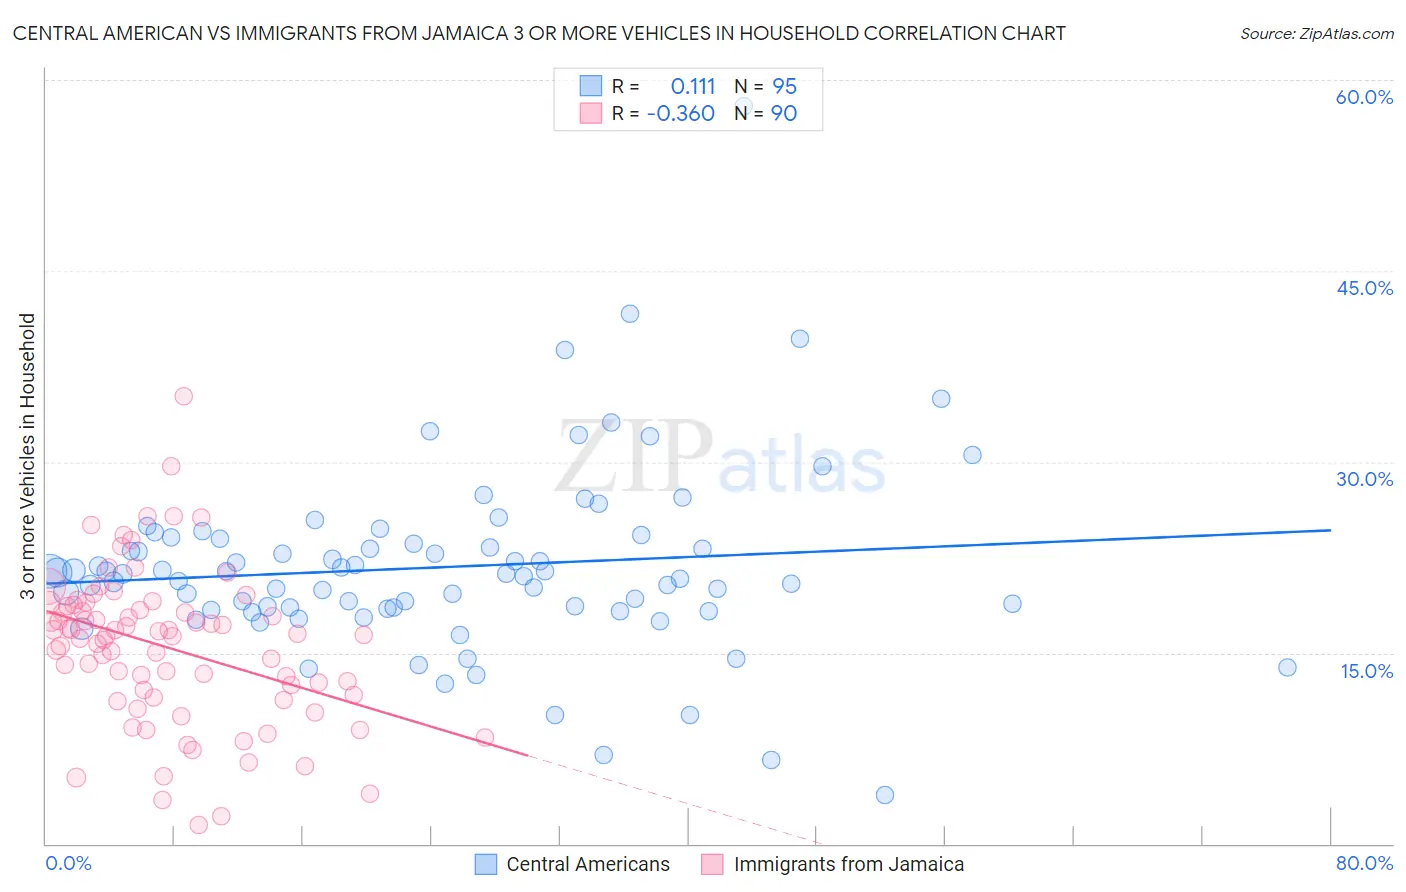
Central American vs Immigrants from Jamaica 3 or more Vehicles in Household Correlation Chart
The statistical analysis conducted on geographies consisting of 503,902,726 people shows a poor positive correlation between the proportion of Central Americans and percentage of households with 3 or more vehicles available in the United States with a correlation coefficient (R) of 0.111 and weighted average of 20.5%. Similarly, the statistical analysis conducted on geographies consisting of 301,546,792 people shows a mild negative correlation between the proportion of Immigrants from Jamaica and percentage of households with 3 or more vehicles available in the United States with a correlation coefficient (R) of -0.360 and weighted average of 14.7%, a difference of 39.4%.
3 or more Vehicles in Household Correlation Summary
| Measurement | Central American | Immigrants from Jamaica |
| Minimum | 3.8% | 1.5% |
| Maximum | 57.9% | 35.2% |
| Range | 54.0% | 33.7% |
| Mean | 21.7% | 15.5% |
| Median | 21.2% | 16.4% |
| Interquartile 25% (IQ1) | 18.5% | 11.7% |
| Interquartile 75% (IQ3) | 24.0% | 18.7% |
| Interquartile Range (IQR) | 5.5% | 7.0% |
| Standard Deviation (Sample) | 7.4% | 6.0% |
| Standard Deviation (Population) | 7.3% | 6.0% |
Similar Demographics by 3 or more Vehicles in Household
Demographics Similar to Central Americans by 3 or more Vehicles in Household
In terms of 3 or more vehicles in household, the demographic groups most similar to Central Americans are Immigrants from Netherlands (20.4%, a difference of 0.030%), Immigrants from Korea (20.5%, a difference of 0.17%), German Russian (20.5%, a difference of 0.18%), Immigrants from Thailand (20.5%, a difference of 0.22%), and Maltese (20.5%, a difference of 0.24%).
| Demographics | Rating | Rank | 3 or more Vehicles in Household |
| Croatians | 94.9 /100 | #117 | Exceptional 20.6% |
| Costa Ricans | 94.6 /100 | #118 | Exceptional 20.6% |
| Immigrants | Latin America | 94.5 /100 | #119 | Exceptional 20.5% |
| Maltese | 93.9 /100 | #120 | Exceptional 20.5% |
| Immigrants | Thailand | 93.8 /100 | #121 | Exceptional 20.5% |
| German Russians | 93.7 /100 | #122 | Exceptional 20.5% |
| Immigrants | Korea | 93.7 /100 | #123 | Exceptional 20.5% |
| Central Americans | 93.1 /100 | #124 | Exceptional 20.5% |
| Immigrants | Netherlands | 92.9 /100 | #125 | Exceptional 20.4% |
| Slavs | 92.1 /100 | #126 | Exceptional 20.4% |
| Immigrants | Bolivia | 92.0 /100 | #127 | Exceptional 20.4% |
| New Zealanders | 91.3 /100 | #128 | Exceptional 20.4% |
| Zimbabweans | 88.7 /100 | #129 | Excellent 20.3% |
| Greeks | 88.6 /100 | #130 | Excellent 20.3% |
| Immigrants | Asia | 88.1 /100 | #131 | Excellent 20.2% |
Demographics Similar to Immigrants from Jamaica by 3 or more Vehicles in Household
In terms of 3 or more vehicles in household, the demographic groups most similar to Immigrants from Jamaica are Immigrants from West Indies (14.6%, a difference of 0.31%), Immigrants from Caribbean (14.6%, a difference of 0.75%), Yup'ik (14.8%, a difference of 1.1%), Cape Verdean (15.0%, a difference of 2.2%), and Immigrants from Yemen (14.2%, a difference of 3.1%).
| Demographics | Rating | Rank | 3 or more Vehicles in Household |
| Immigrants | Belarus | 0.0 /100 | #314 | Tragic 15.5% |
| Haitians | 0.0 /100 | #315 | Tragic 15.5% |
| U.S. Virgin Islanders | 0.0 /100 | #316 | Tragic 15.4% |
| Jamaicans | 0.0 /100 | #317 | Tragic 15.2% |
| Immigrants | Haiti | 0.0 /100 | #318 | Tragic 15.2% |
| Cape Verdeans | 0.0 /100 | #319 | Tragic 15.0% |
| Yup'ik | 0.0 /100 | #320 | Tragic 14.8% |
| Immigrants | Jamaica | 0.0 /100 | #321 | Tragic 14.7% |
| Immigrants | West Indies | 0.0 /100 | #322 | Tragic 14.6% |
| Immigrants | Caribbean | 0.0 /100 | #323 | Tragic 14.6% |
| Immigrants | Yemen | 0.0 /100 | #324 | Tragic 14.2% |
| Senegalese | 0.0 /100 | #325 | Tragic 14.2% |
| Soviet Union | 0.0 /100 | #326 | Tragic 14.2% |
| Ecuadorians | 0.0 /100 | #327 | Tragic 14.1% |
| Immigrants | Albania | 0.0 /100 | #328 | Tragic 14.0% |